Screen walkthrough
Every screen in the dashboard, as it renders, with what it is for and what to press. Seventy-five screens including the detail pages and their sub-tabs, each captured at desktop (1440px) and phone (390px) width.
How these were captured
Against a real synapse-api on a real PostgreSQL with row-level security enforced, driven through
a browser so every request hit the live backend; the mock service worker was off. The data is real,
produced by running the product rather than seeded into its tables:
- an engagement scanned against a clone of OWASP Juice Shop: 2,862 findings, and a supply chain of 1,171 components over 733 dependency edges, so each of its 86 vulnerabilities carries a path from a direct dependency rather than appearing as an unattributed transitive;
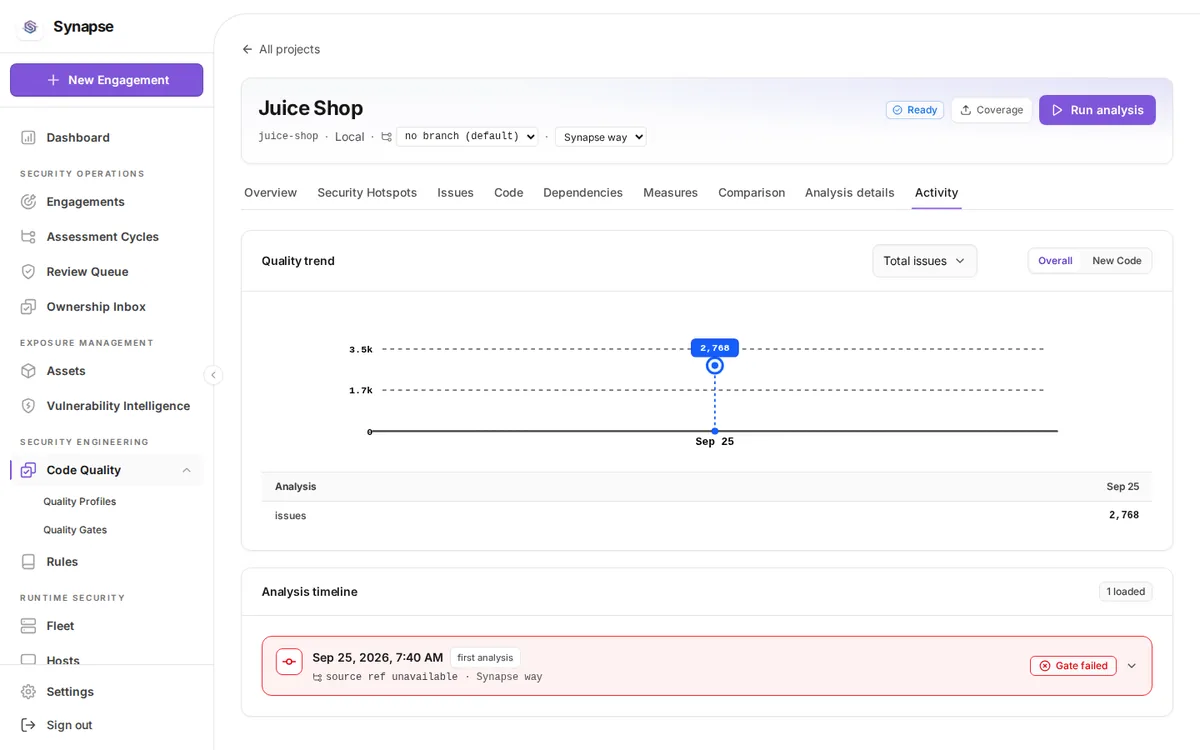
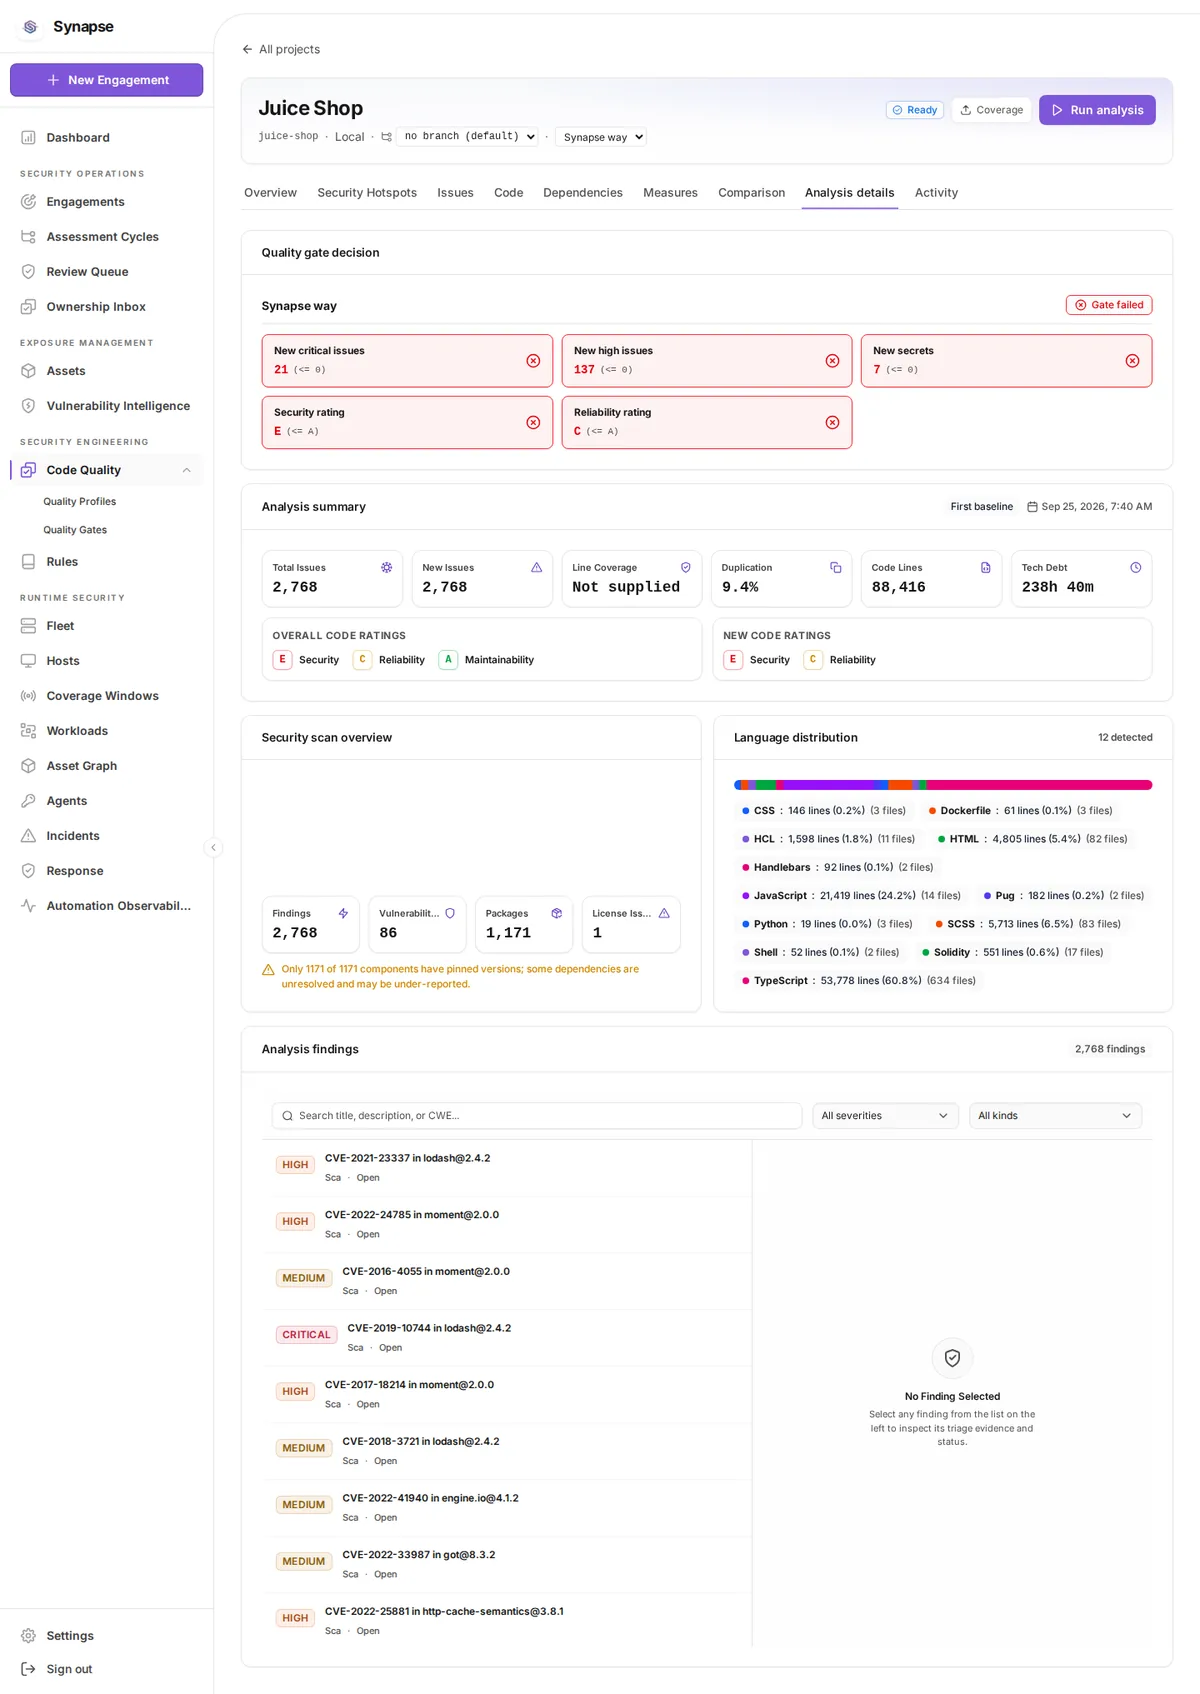
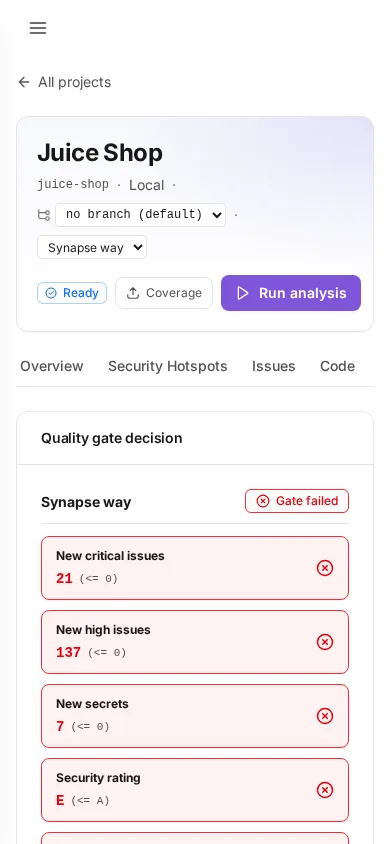
- a code-quality project analysed from the same source: 2,768 issues, with the managed quality gate failed on new code at 21 critical and 137 high;
- a live reconnaissance run:
httpxagainst a host inside the engagement's scope, returning its server banner and detected technologies, executed sandboxed-live with egress restricted to that single destination; - three fleet agents shipping signed detections that correlate into three incidents;
- a placed legal hold, with erasure refused for as long as it stands;
- four business assets.
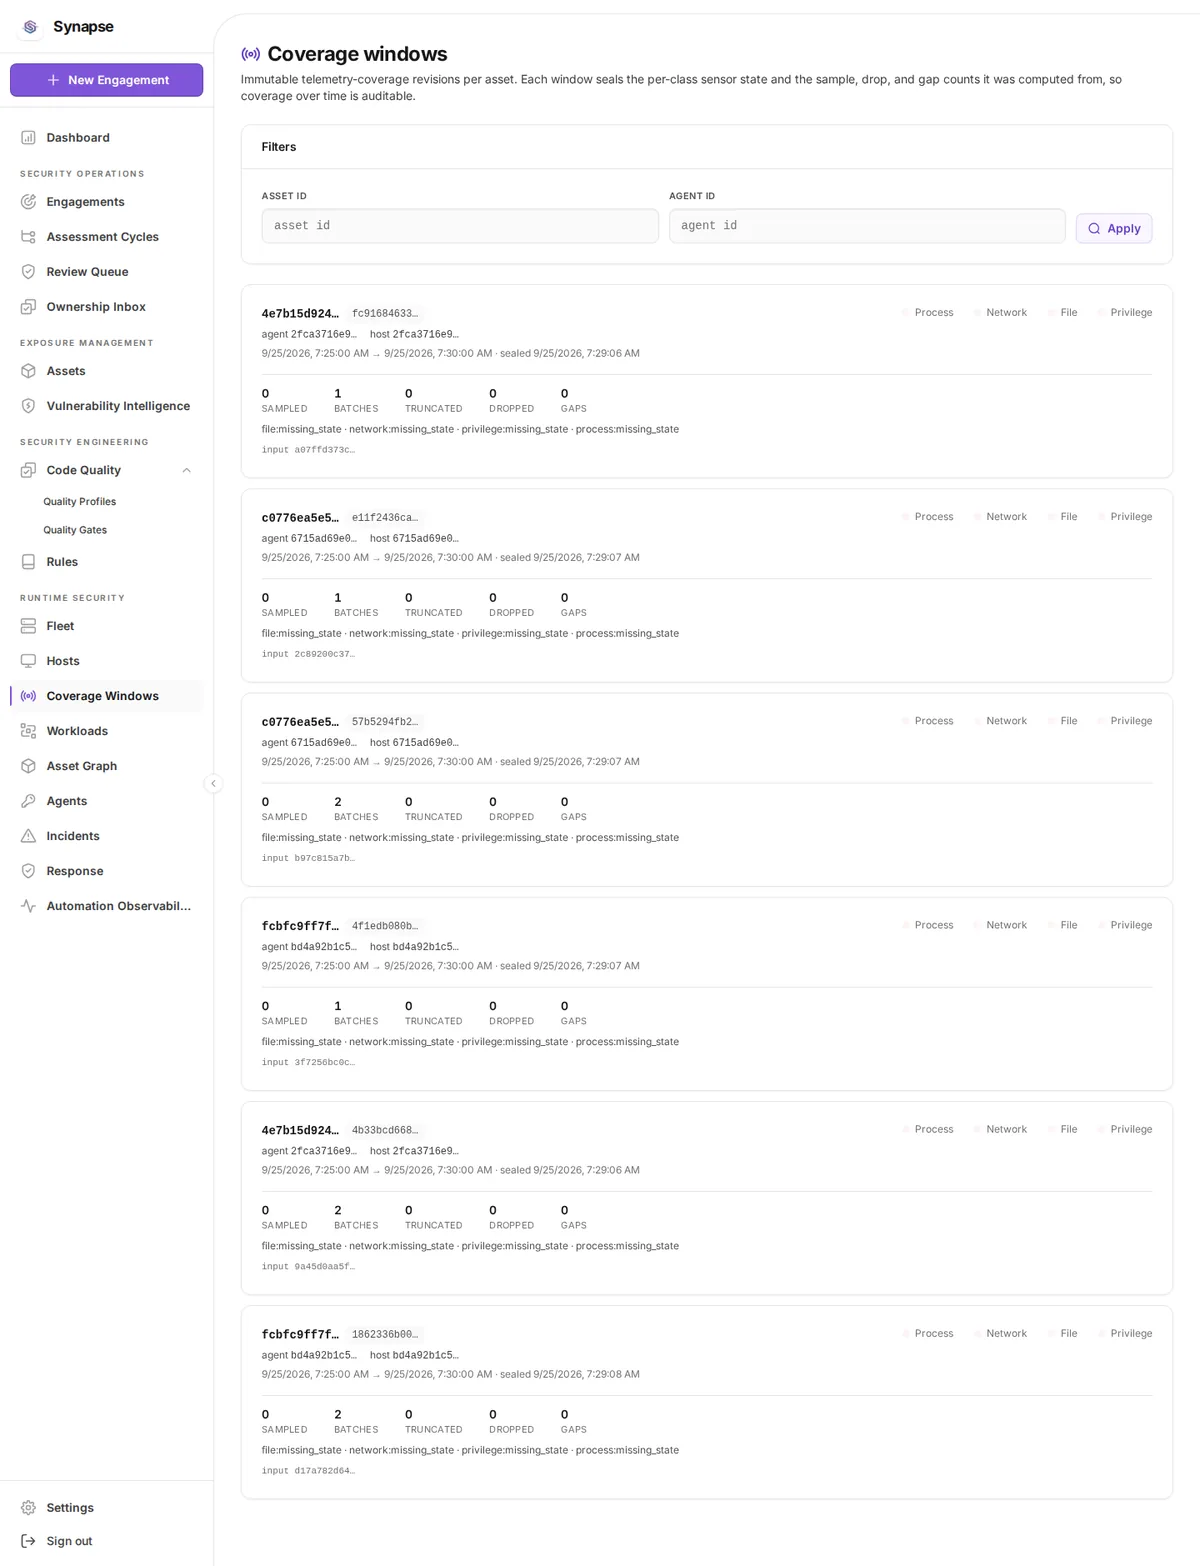
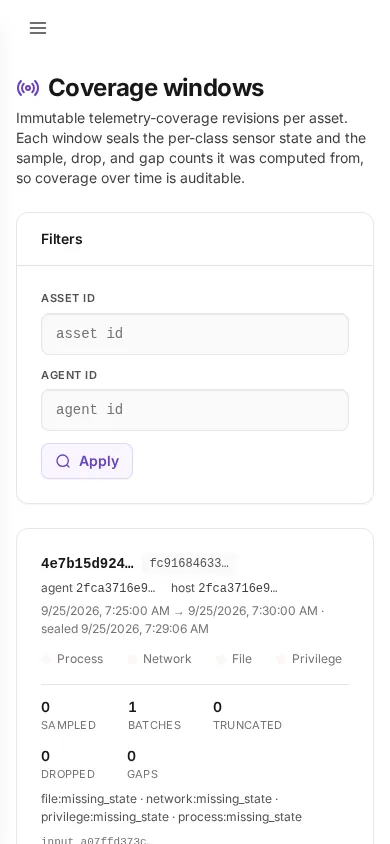
Seventeen of the nineteen capabilities were on. Cloud posture and OIDC browser login were off, because each needs credentials this host had no reason to hold, and the screens behind them say so rather than showing an empty result. Coverage Windows is empty for a stated reason of its own: it materialises from sensor-state observations, and the eBPF sensors cannot load here, so the agent reports no runtime evidence and there is nothing to window.
Capture faults were fixed before any of this was published, each of which had put something untrue in this guide:
- The screenshots held one viewport, not the screen. The app scrolls inside a container rather than the document, so asking for a full-page capture changed nothing and every image stopped at the fold. The sweep now measures the page-level scroller and grows the viewport to it, which is why the longer screens here run to several thousand pixels.
- Risk Stories was published as a spinner.
networkidleis not "the screen has rendered": a tab that starts its own fetch after hydration is still loading when the network goes quiet. The sweep waits for the main region to stop saying it is loading, and reports a screen that never stops rather than photographing it. - Four screens were captured while the API was restarting and show the signed-out state. The heading check caught them and they were retaken.
The Code screen changed for a different reason: synapse-cli publish-source could not publish
anything until it was repaired, so it read "Source preview unavailable: Not retained" beside a
caption promising annotated source.
Regenerate them with the dev server running and a token the backend accepts:
cd web
VITE_API_PROXY_TARGET=http://localhost:8080 pnpm dev   # in one shell
UI_AUDIT_TOKEN=<api token> pnpm ui:audit               # in another
pnpm ui:audit also reports what a screenshot cannot show: a rendered error, a screen still
loading, a capture that ran past the cap, a missing page heading, content clipped where a user
cannot reach it, a focusable control inside aria-hidden, a button with no accessible name, and
a failed API call. Pass UI_ROUTES to sweep detail screens and sub-tabs, and
UI_AUDIT_NAV_TIMEOUT / UI_AUDIT_SETTLE_TIMEOUT when the backend is remote: an engagement's
scan result is measured in megabytes, and against a slow link the default budget photographs the
screen before its data arrives.
Each of those checks is written to fire only on something a user would notice. A wide table in
its own scroller, a full-bleed bar, a truncated id whose row carries the full value in a title,
and a closed drawer held out of the tab order by inert are all correct, and a check that
reports them buries the ones that are not. A 404 from a tenant-scoped read is absence, not
failure, and is reported as such: this engagement has no imported SBOM, no published source, no
threat model, no Assessment Cycle.
What the sweep measured
pnpm ui:audit also records every /api/v1 request the app makes while it drives the screens, so
API coverage can be read from what the product actually calls rather than from a static scan of the
client. Loading all 75 screens exercised 98 of the 371 registered routes.
The other 275 are not unreachable; they need something a page load does not do:
- 176 are mutations (
POST,PUT,PATCH,DELETE). A read-only sweep never presses a button. - 99 are GETs that open on a selection:
/agent/sessions/{sid},/recon/runs/{rid},/evidence/{sha},/findings/{fid}/comments, the report and export downloads. You reach them by clicking a row, not by loading a screen.
So this number bounds coverage from below, and does not answer "is anything unreachable" on its own.
That question was answered separately by auditing every method in web/src/lib/api against its
consumers: 331 methods, of which 12 have no caller. None is an unmapped capability. Two are
superseded (reopenAssessmentCycle lost to the preview-and-commit flow, listNotificationDeliveries
to its paged replacement) and the rest are single-record reads whose list already carries the row
(assessmentSnapshot, findingSLA, getDastRun, getProjectIssue, ownershipPolicy,
ownershipTeam, projectAnalysis, reconRun, vulnerabilityAdvisory) or a duplicate accessor
(listCapabilities).
Run the same audit yourself against a sweep's output: api-calls.json in the capture directory
holds every route the app requested, and the registered set comes from the mux.HandleFunc
literals across internal/adapter/httpapi. The count from this pass was 371 registered, 98
exercised, and nothing the frontend calls that no route serves.
Where that audit found a real gap, the gap was closed rather than recorded: user administration, the assessment-cycle archive, snapshot finalize, issue review history, and the SLA decision record all reached the API and no screen before this pass.
Start
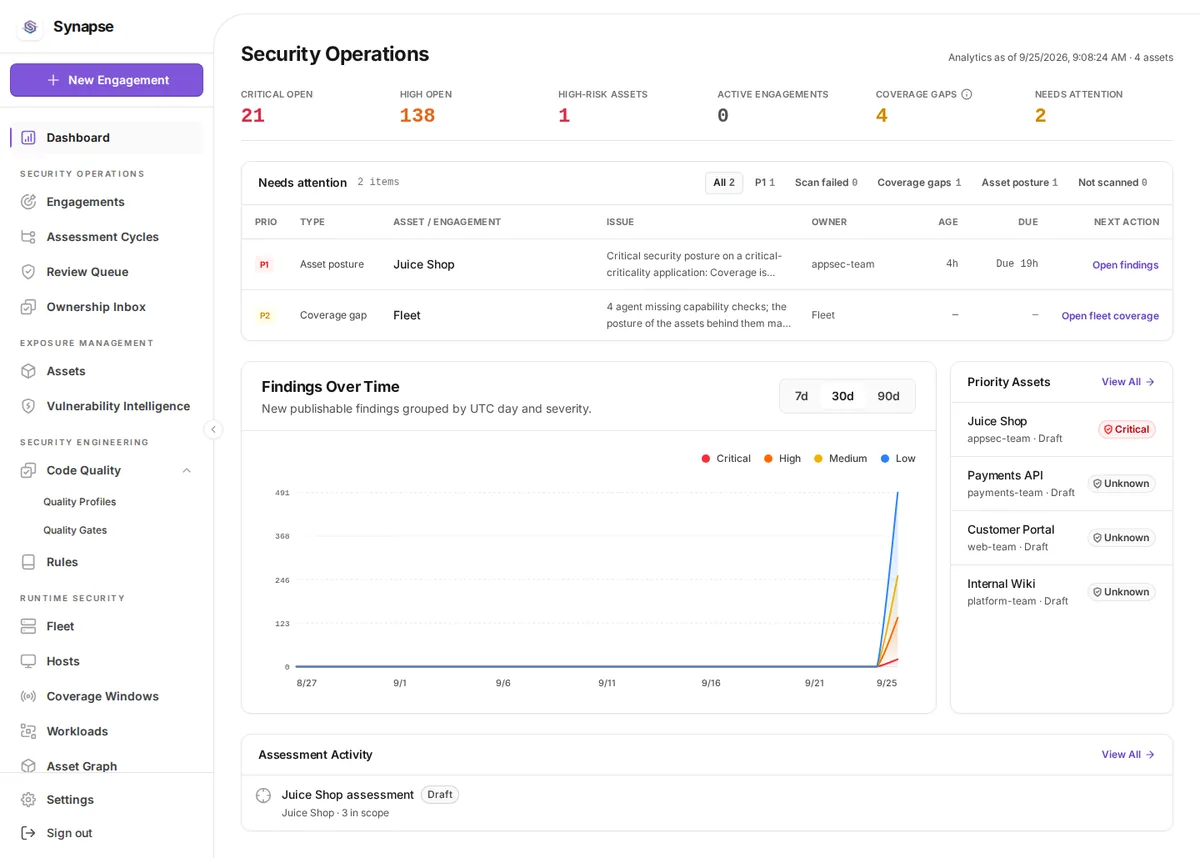
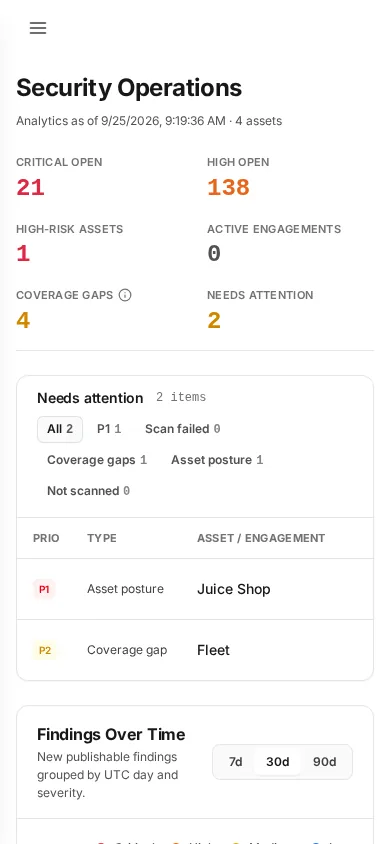
Security Operations
/dashboard
The landing screen: what needs a person today, ranked, with the next action named.
- Read the strip: Critical open, High open, High-risk assets, Active engagements, Coverage gaps, Needs attention.
- Change the window with
7d/30d/90d. - Filter the queue with
All,P1,Scan failed,Coverage gaps,Asset posture,Not scanned. - Work the table: Prio, Type, Asset / engagement, Issue, Owner, Age, Due, Next action (the link you follow).
Excluded findingsexplains what the counts leave out, so a low number is not read as a clean result.
Security operations
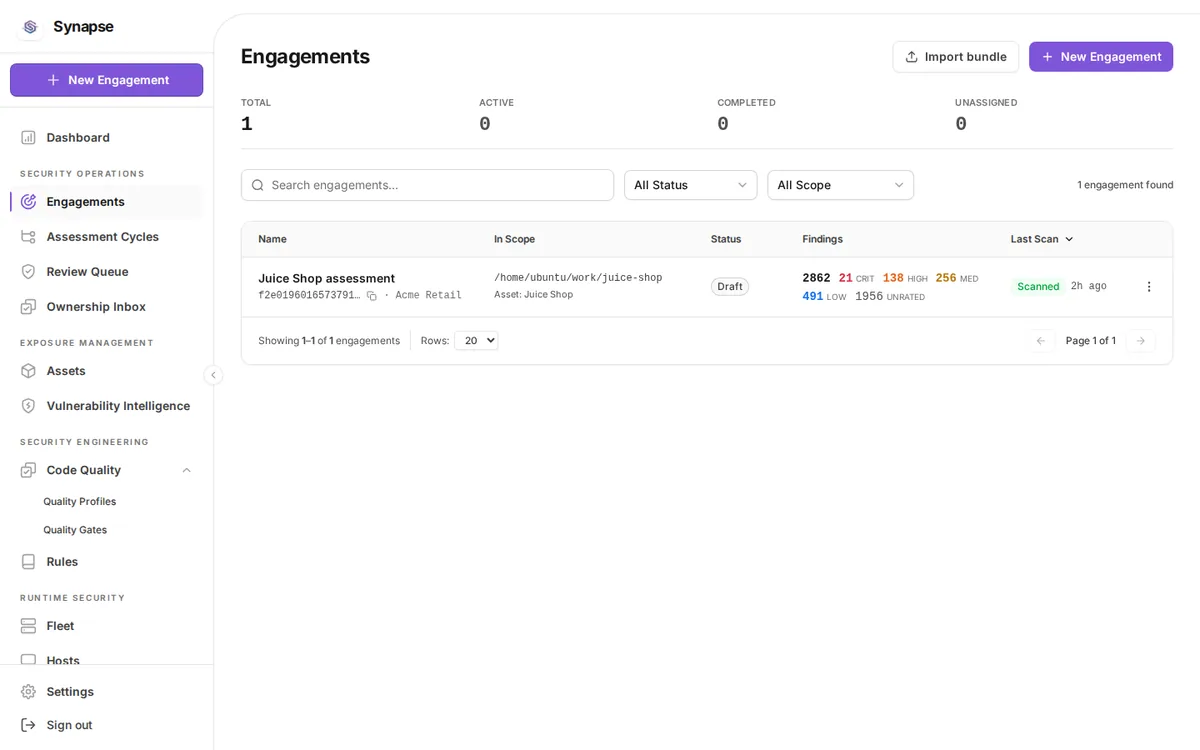
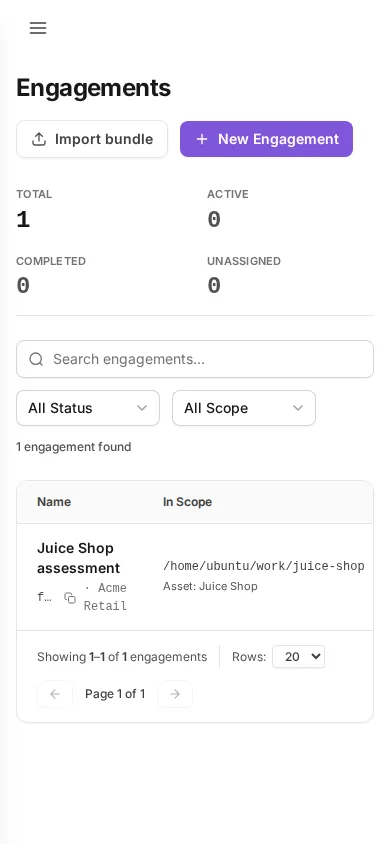
Engagements
/engagements
Every time-boxed assessment with its scope, status and finding counts.
- Read Total, Active, Completed, Unassigned.
- Narrow with the search box and the
All Status/All Scopeselects. - The Findings column breaks down by crit, high, med, low, and unrated when a finding carries no severity yet.
- Click a name to open the engagement; the copy icon copies its id.
Import bundletakes a CI bundle;New Engagementstarts one.
New Engagement
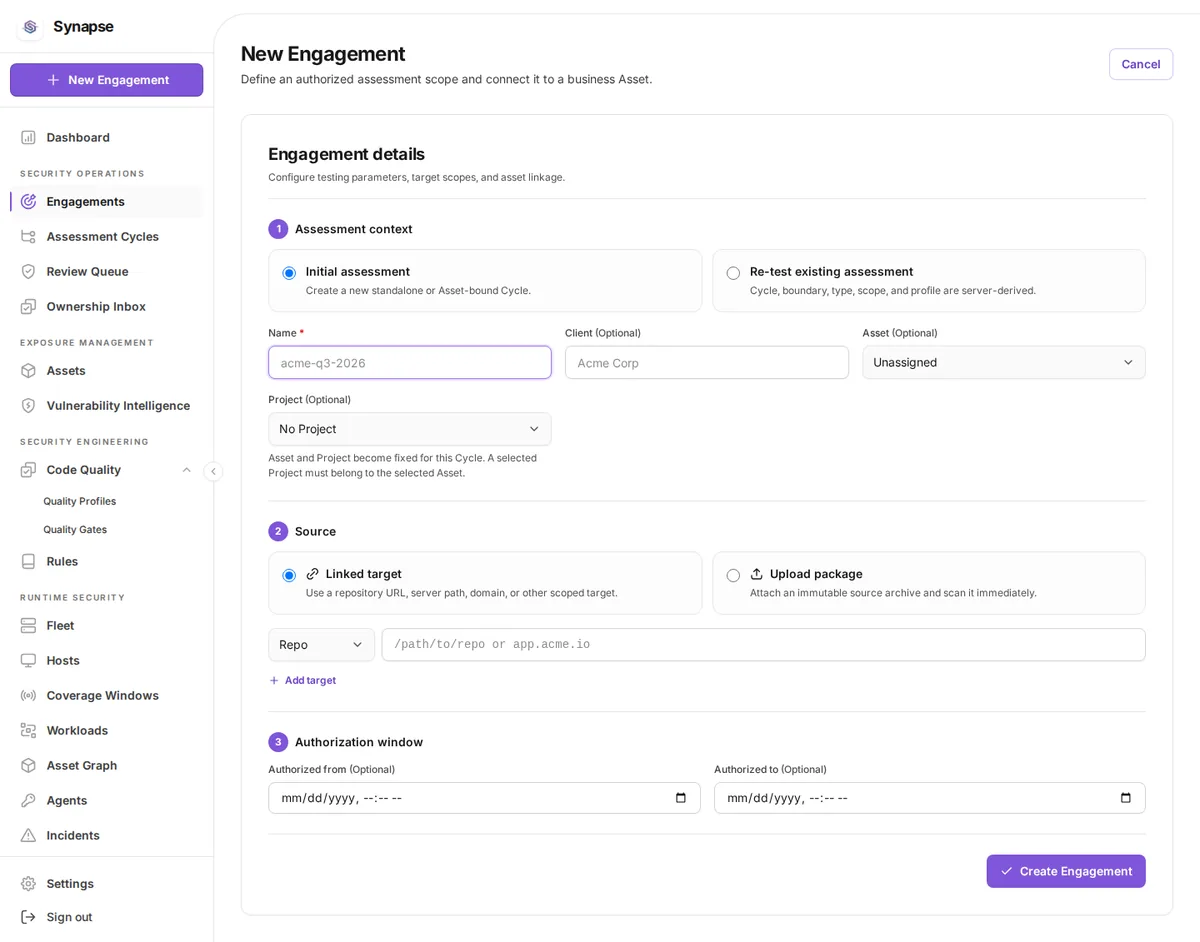
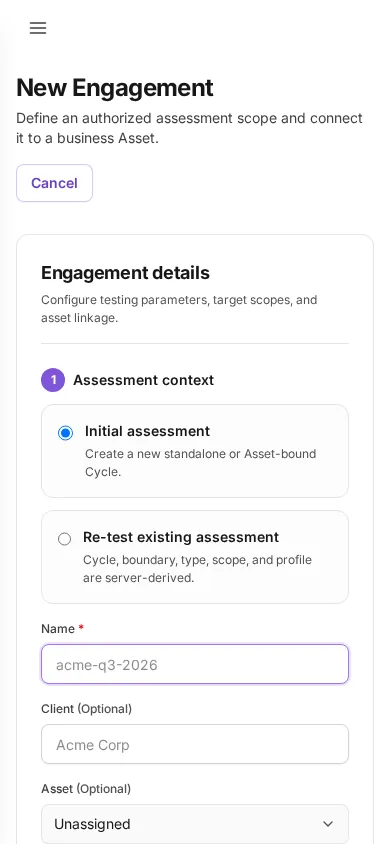
/engagements/new
Creates the scope and the authorization window. Both are enforced server-side before any tool runs.
- Name the engagement.
- Pick the owner or leave it
Unassigned. - Choose the target kind and enter the target.
Add targetfor each further target in scope.Create Engagement.
Assessment cycles
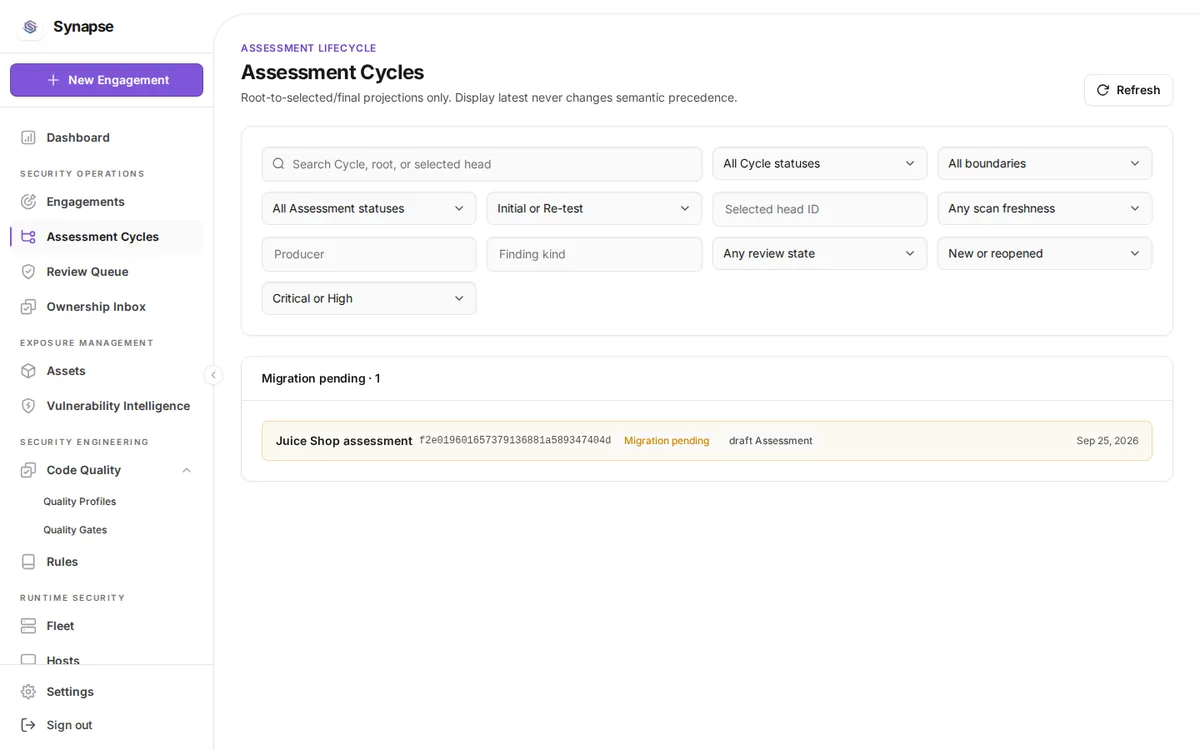
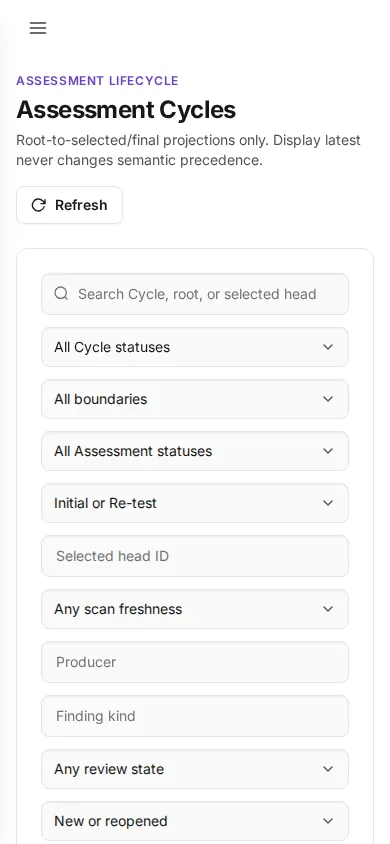
/assessment-cycles
The long-lived cycle grouping an initial assessment and its re-tests.
- Open a cycle for its frozen root-to-final path and closure history.
Review closurefetches a server-signed preview; a commit without one is refused.Review reopenreverses it and keeps the sealed manifest immutable.Archive Cycleends it permanently; the dialog says so, because the domain allows no transition out of archived.
AI Triage Reviews
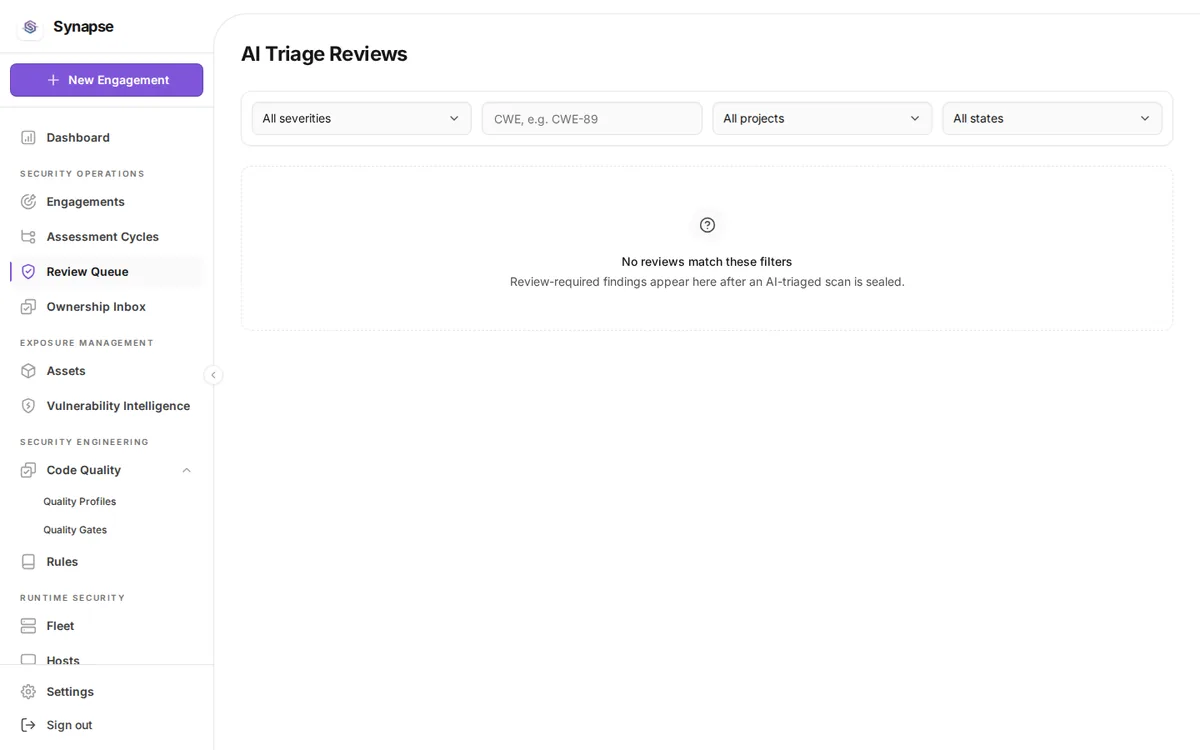
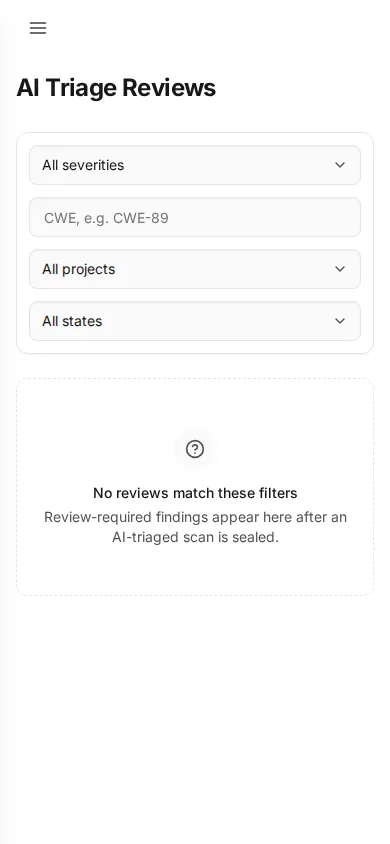
/ai-triage/reviews
The human review queue for AI-proposed triage. A proposer never confirms its own claim.
- Filter with
All severities,All projects,All states. - Open a review to read the proposal and its evidence.
- Claim it, then decide. The decision is recorded against your identity.
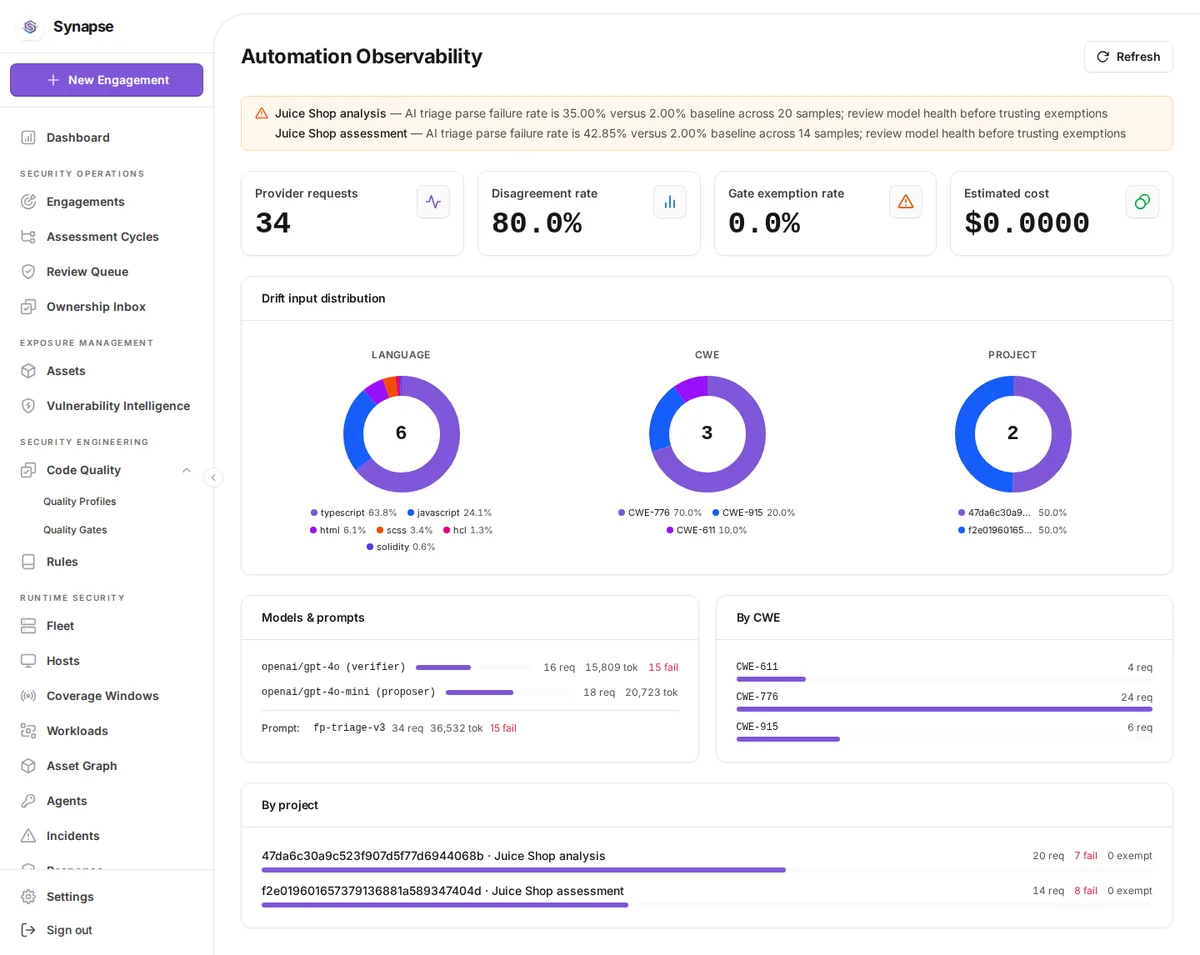
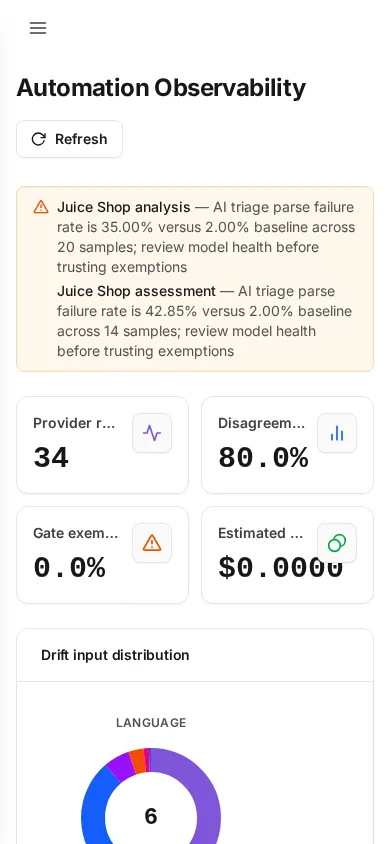
Automation Observability
/ai-triage/observability
What the automation did and how well it held up, so the triage pipeline can be audited.
- Read the counters.
Refreshre-pulls them.
Ownership inbox
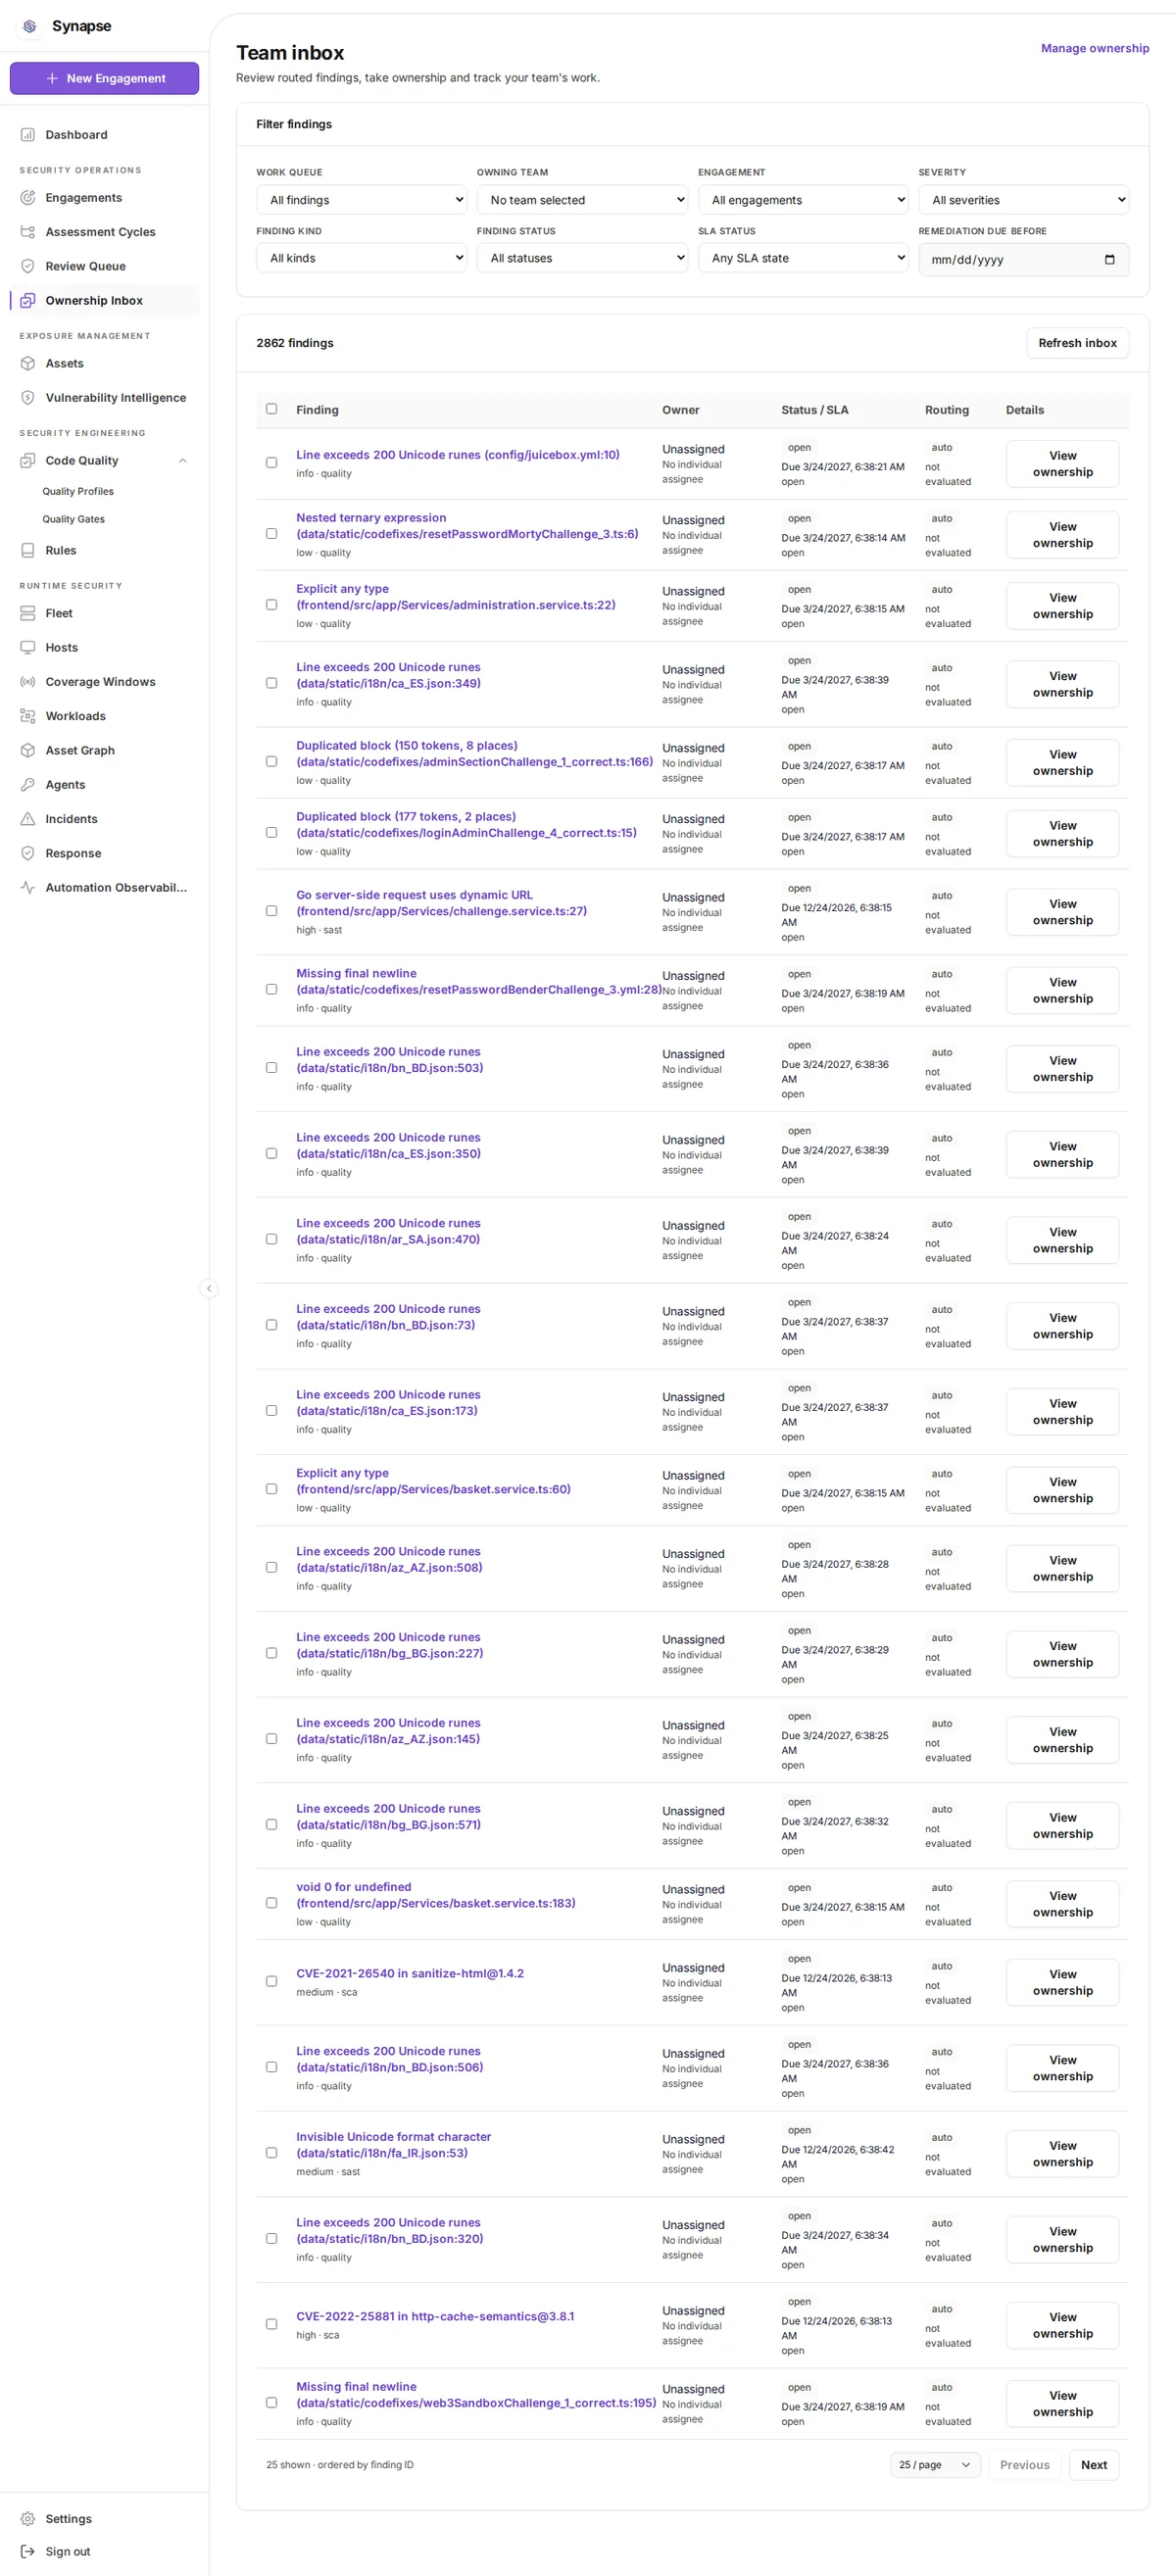
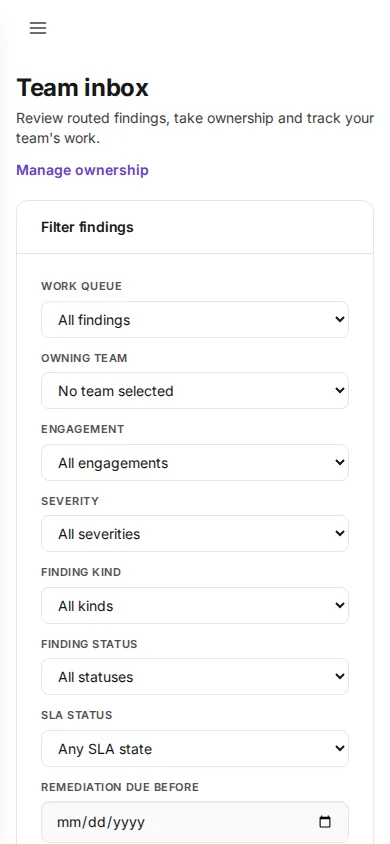
/ownership
Findings routed to your teams, so each has a named owner.
- Filter to your teams or to a severity.
- Select findings and reassign in bulk.
- Open one for its ownership history and who changed it.
Exposure management
Security Asset Inventory
/assets
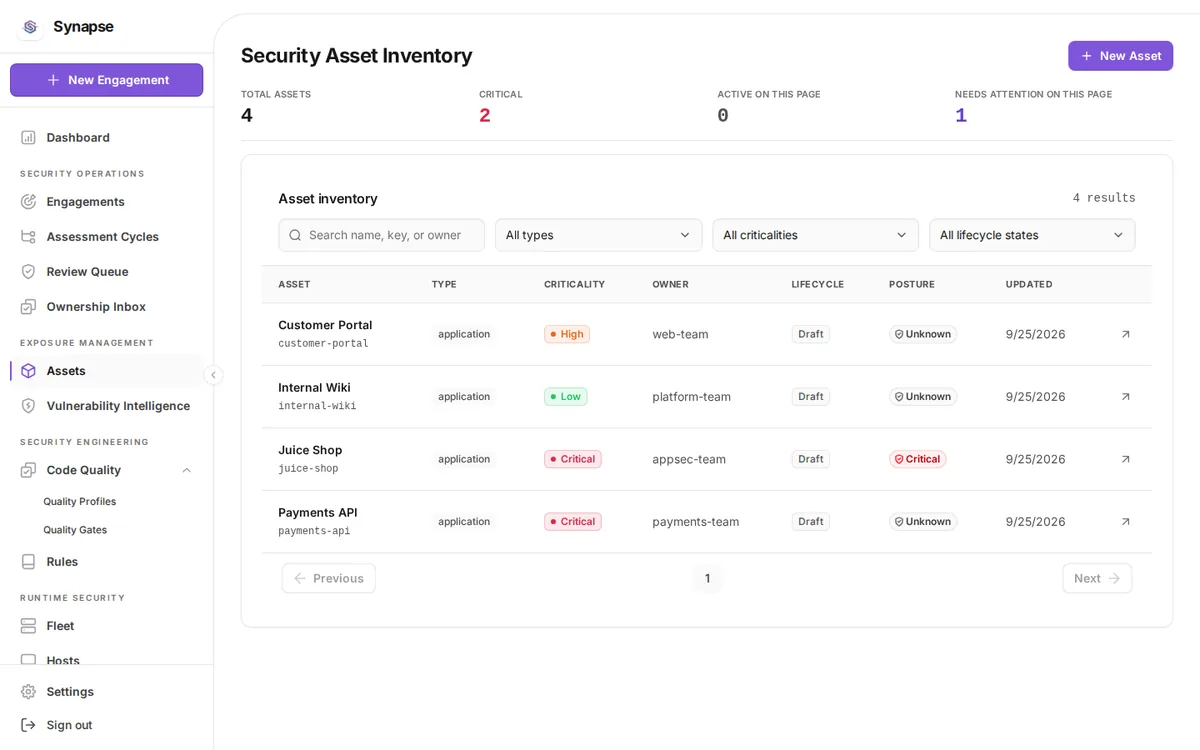
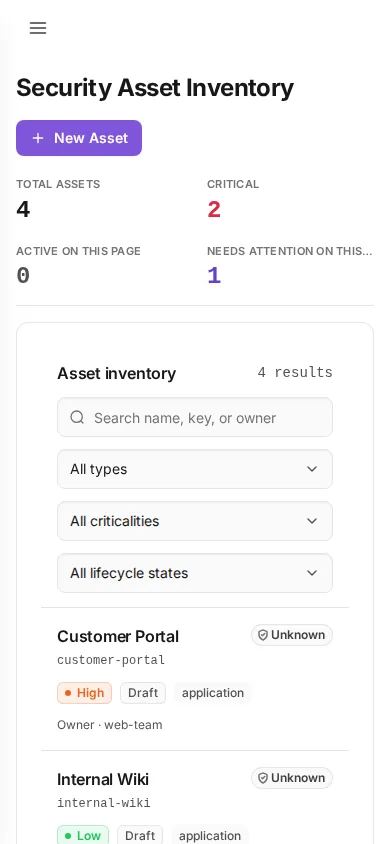
The business-asset estate: what exists, how critical, who owns it, and whether its posture is known.
- Total assets and Critical are estate-wide; Active on this page and Needs attention on this page say their scope in the label.
- Narrow with the search box and the type / criticality / lifecycle selects.
- A posture of Unknown means not assessed, never clean.
- Page with
Previous/Next; the filter and the page are applied in the database. New Assetadds one; the open arrow on a row opens the asset.
Vulnerability Intelligence
/vulnerability-intelligence
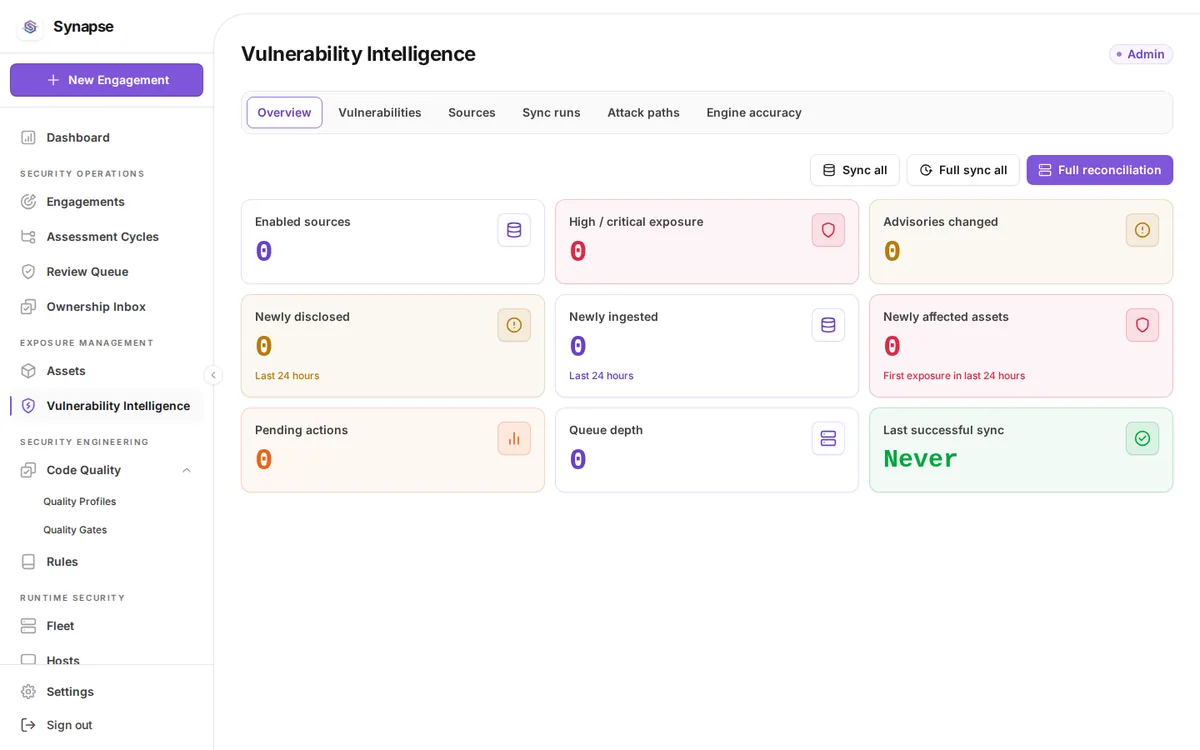
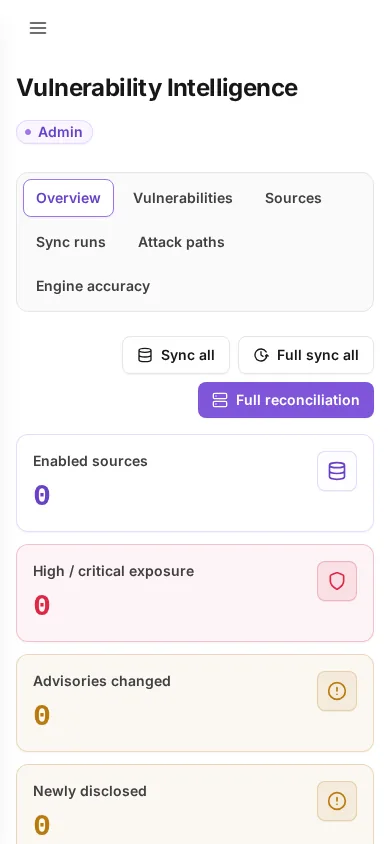
Advisory ingest, the vulnerabilities it produced, and the machinery that keeps both current.
- Move between
Overview,Vulnerabilities,Sources,Sync runs,Attack paths,Engine accuracy. Sync allpulls every enabled source;Full sync allre-pulls from the beginning.Full reconciliationre-evaluates existing findings against the current advisory set.- Engine accuracy holds the owned engine's measured results, so a detection-quality claim can be checked.
Security engineering
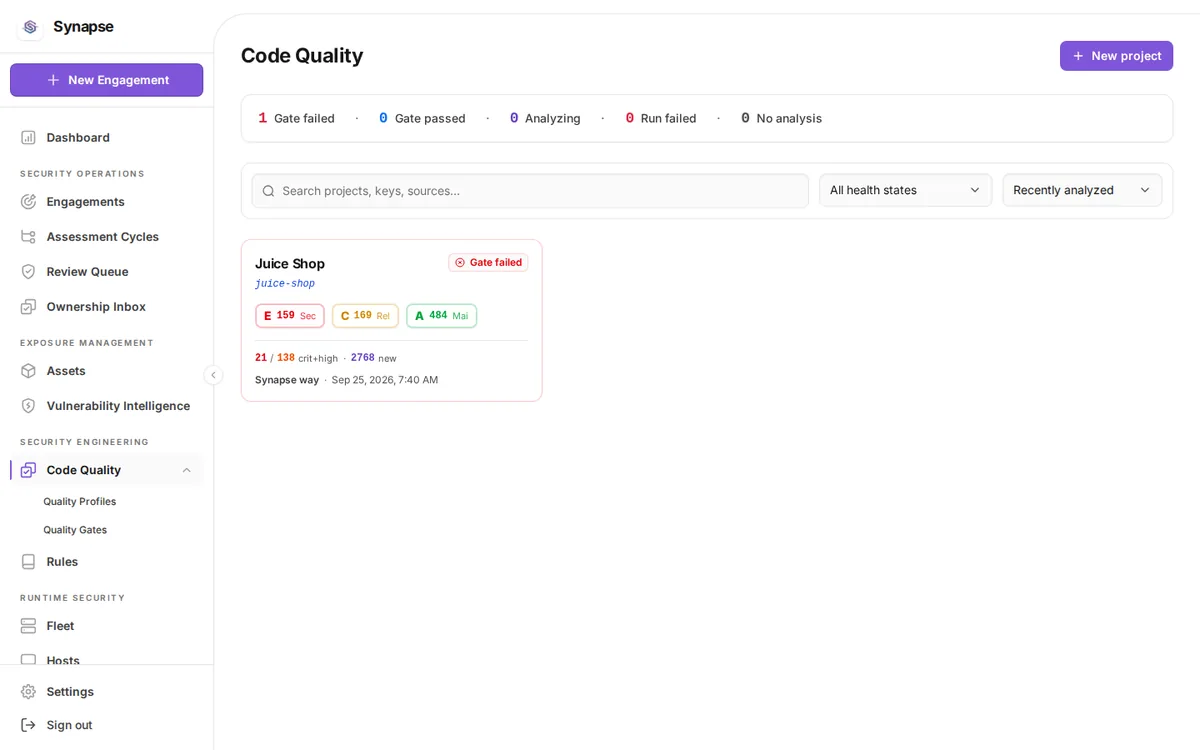
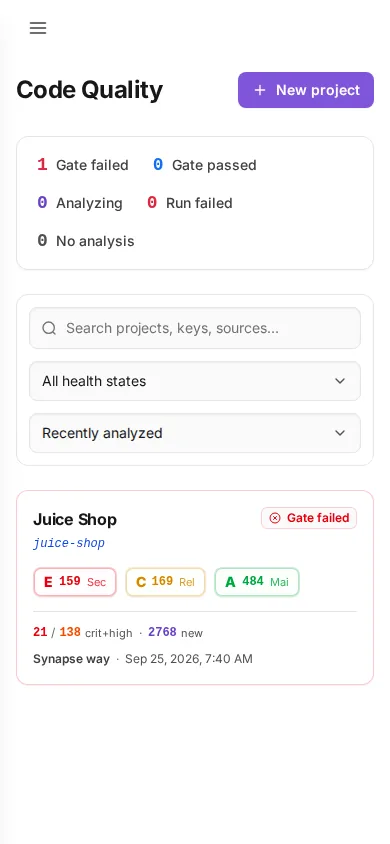
Code Quality
/code-quality
Long-lived project identities and their health, separate from time-boxed engagements.
- Filter with
All health states; order withRecently analyzed. - Open a project for its hotspots, issues, code, dependencies, measures, comparison, analysis and activity.
New projectregisters one.
Quality Gates
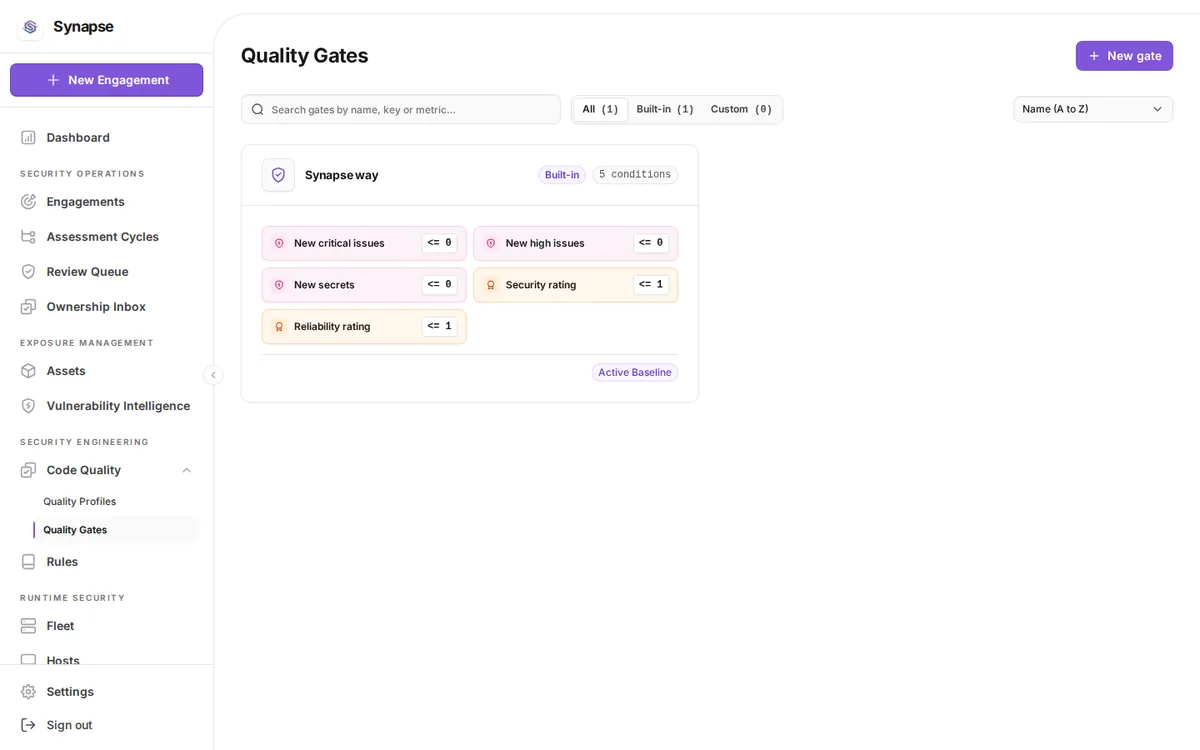
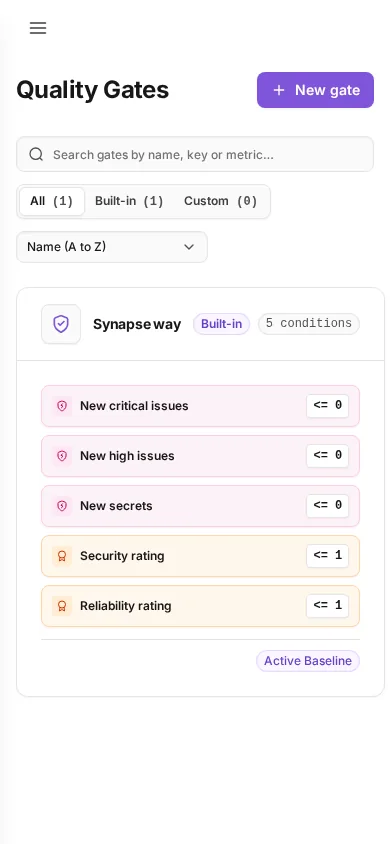
/code-quality/gates
The pass/fail conditions a project's analysis is judged against.
- Filter by
All/Built-in/Custom; order withName (A to Z). - Open a gate to read its conditions.
New gatecreates a custom one; built-ins cannot be edited.
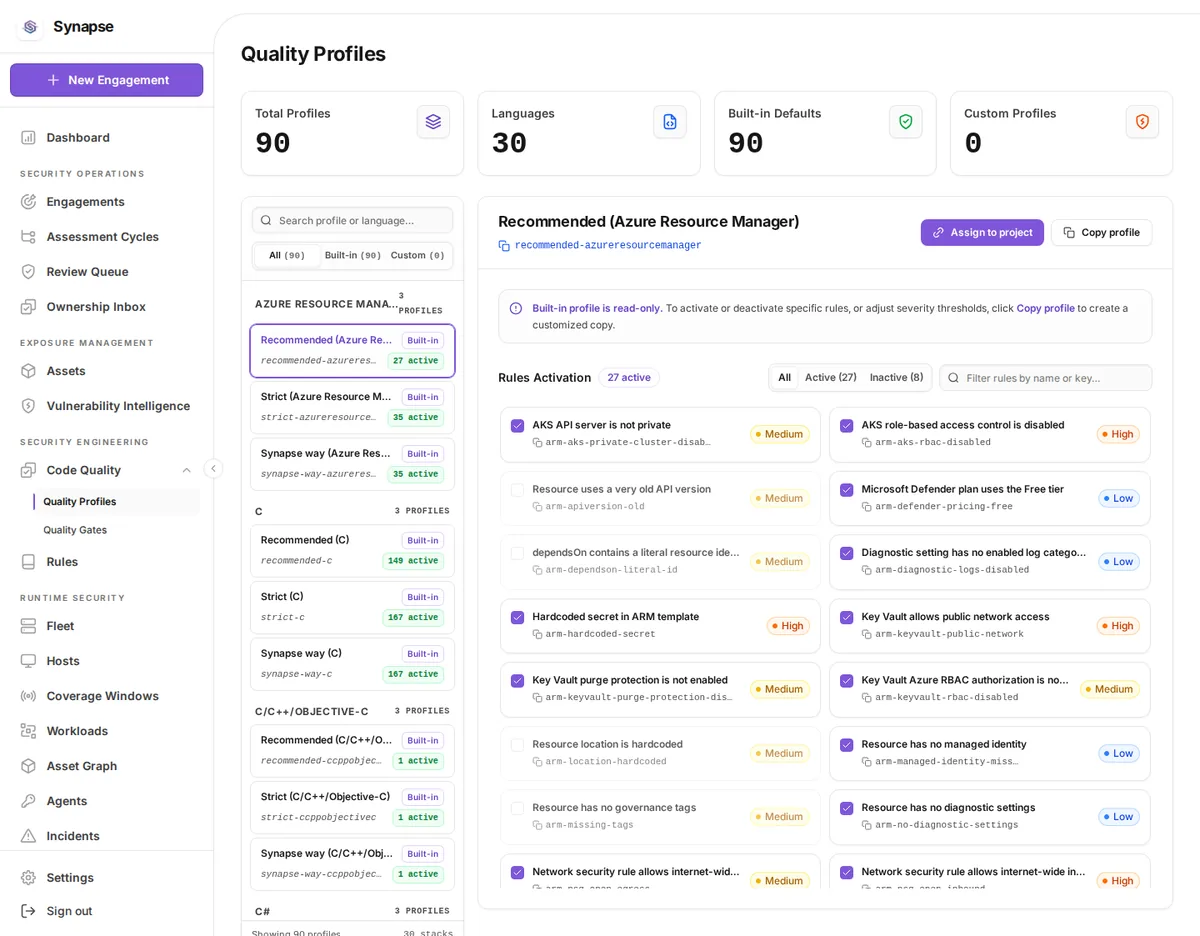
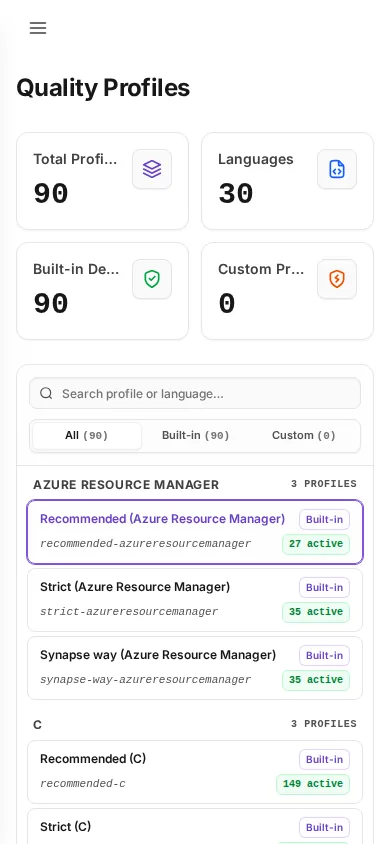
Quality Profiles
/code-quality/profiles
Which rules are active per language. Ninety built-in profiles ship, three per language.
- Filter by
All/Built-in/Custom. - Pick a language group, then a profile; each row shows its active rule count.
- Copy a built-in to get a custom profile you can edit.
Rules
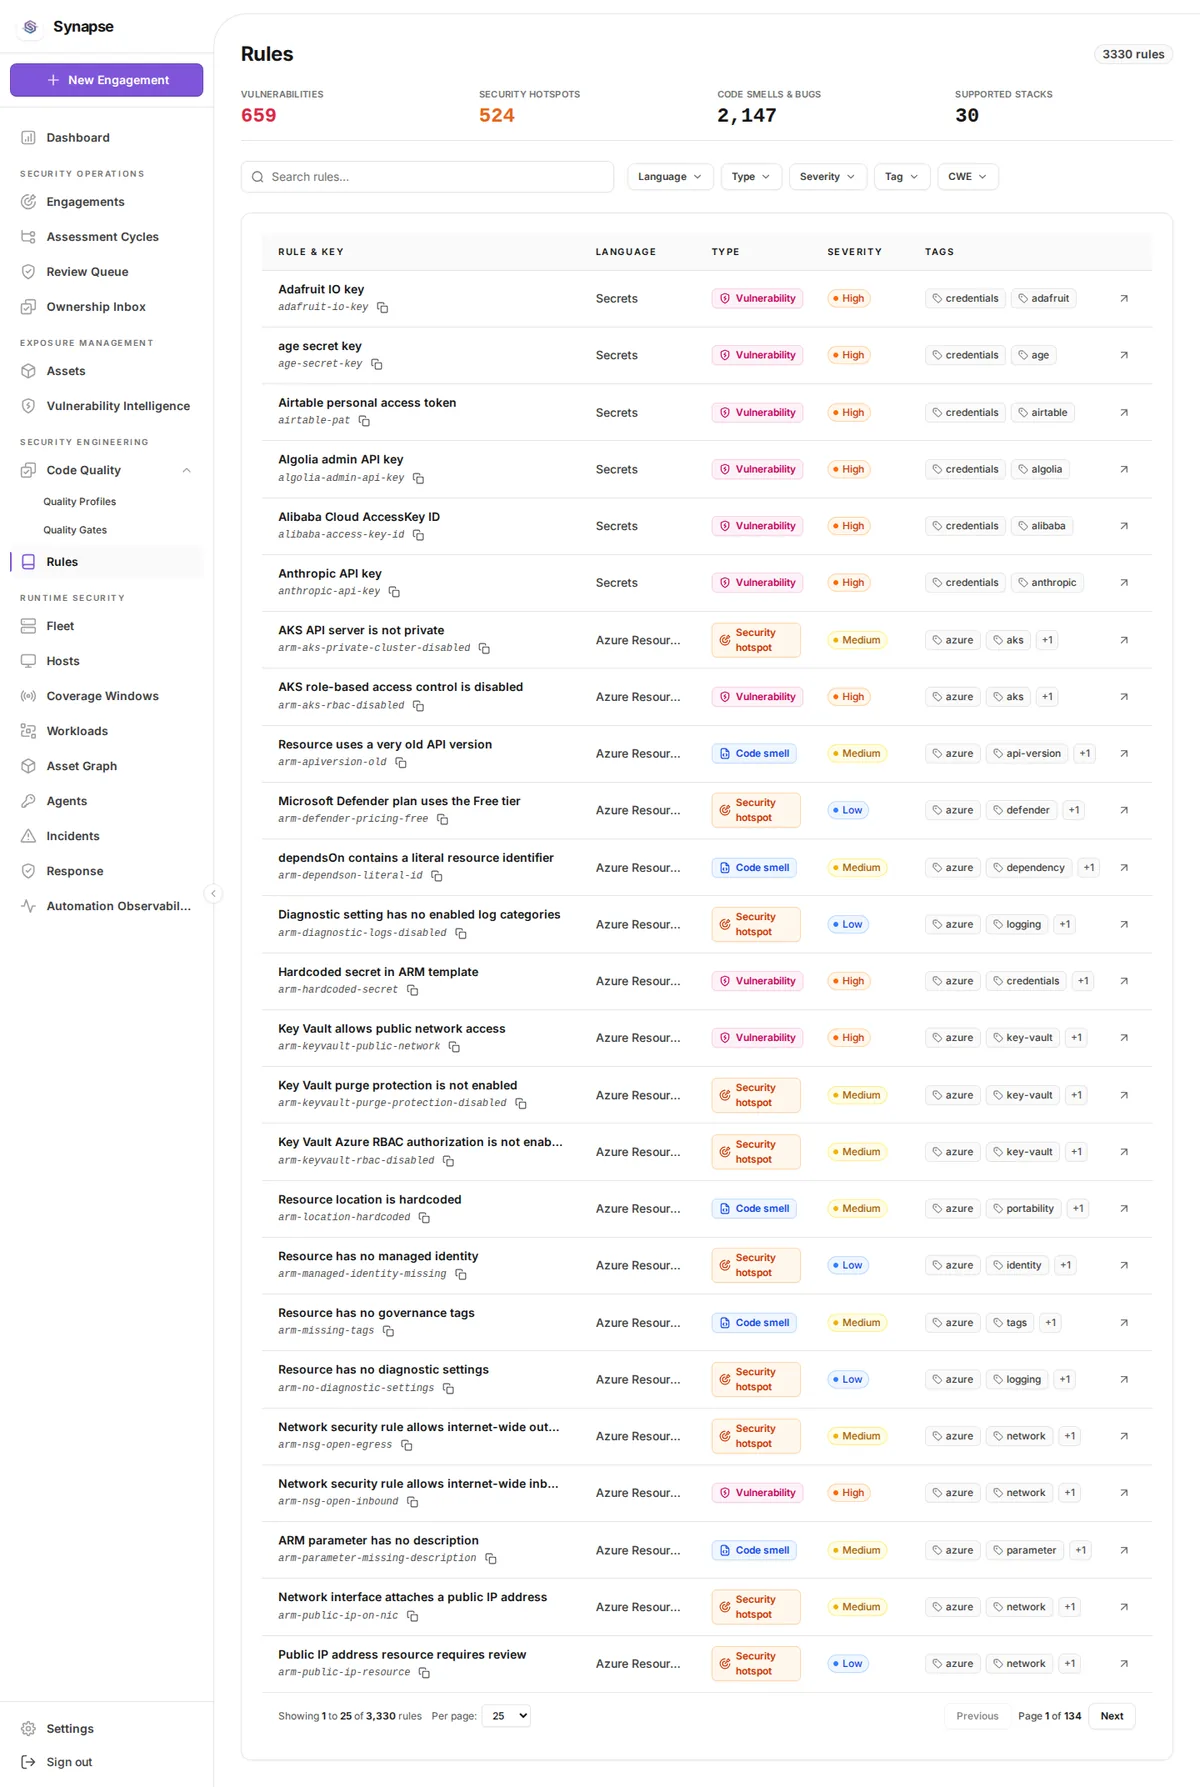
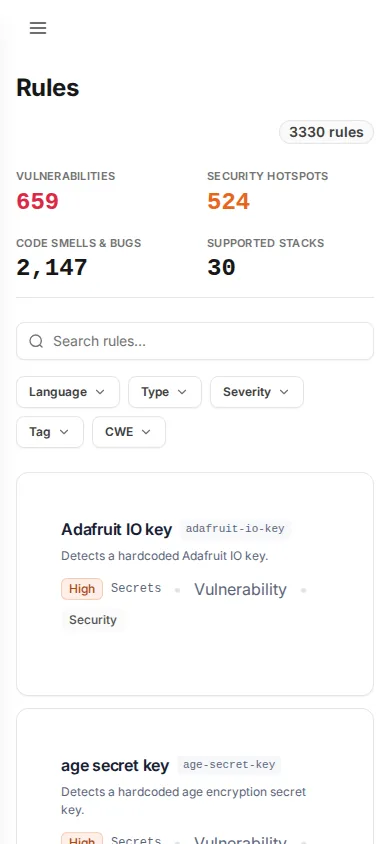
/rules
The detection catalogue: every rule the scanners can apply.
- Read Vulnerabilities, Security hotspots, Code smells & bugs, Supported stacks.
- Filter with
Language,Type,Severity,Tag,CWE. - The copy action on a row copies the rule key for a profile or a suppression.
Runtime security
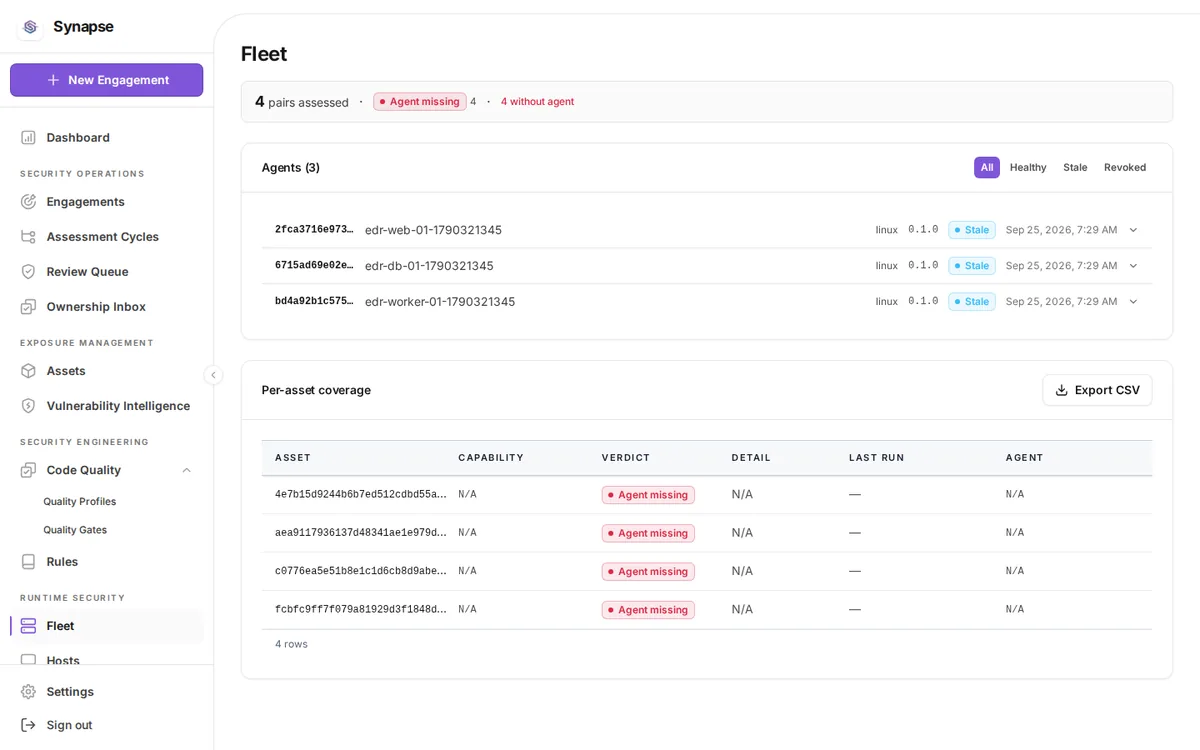
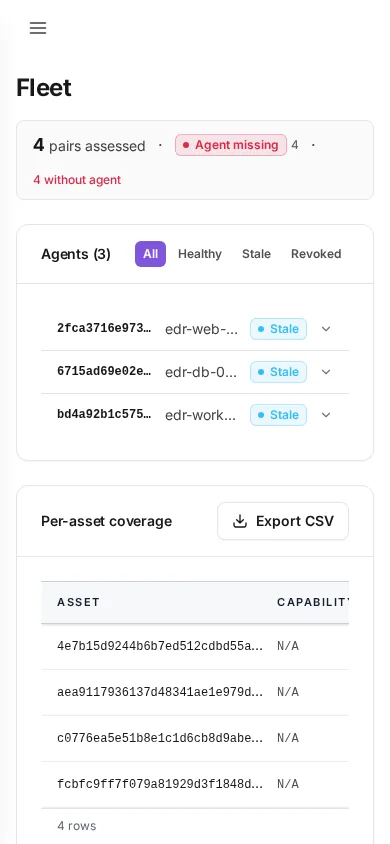
Fleet coverage
/fleet
Which assets an agent covers, per capability, and how fresh that coverage is.
- Filter agents by
All/Healthy/Stale/Revoked. - A verdict of unauthorized is its own label and is never folded into covered.
- The desired-capability gaps section lists capabilities an asset should have and does not; a failure there is shown, not rendered as no gaps.
Export CSVtakes the current view out.
Agent administration
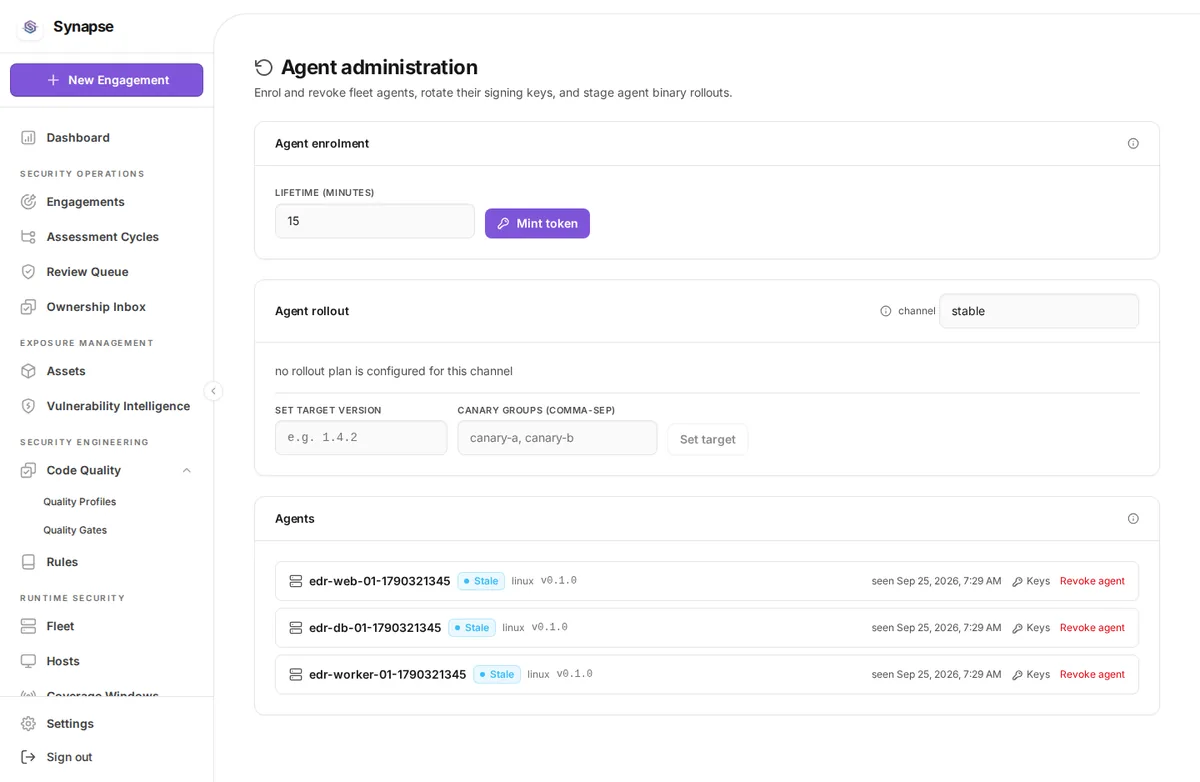
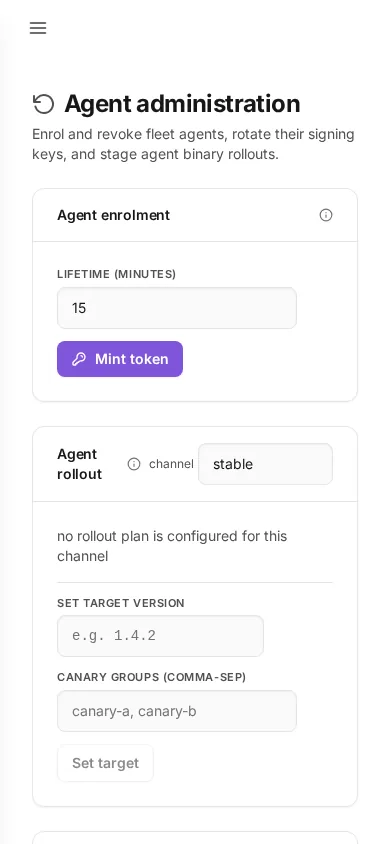
/fleet/agents
Enrolment, staged rollout of the agent binary, and the lifecycle of an agent and its keys.
- Set Lifetime (minutes) and press
Mint token. The token is shown once and is spent on first use. - Enter Set target version and Canary groups, then
Set target. - Promote, pause or resume the rollout; a pause takes a reason.
- List an agent's keys, revoke one key, or revoke the agent with a reason.
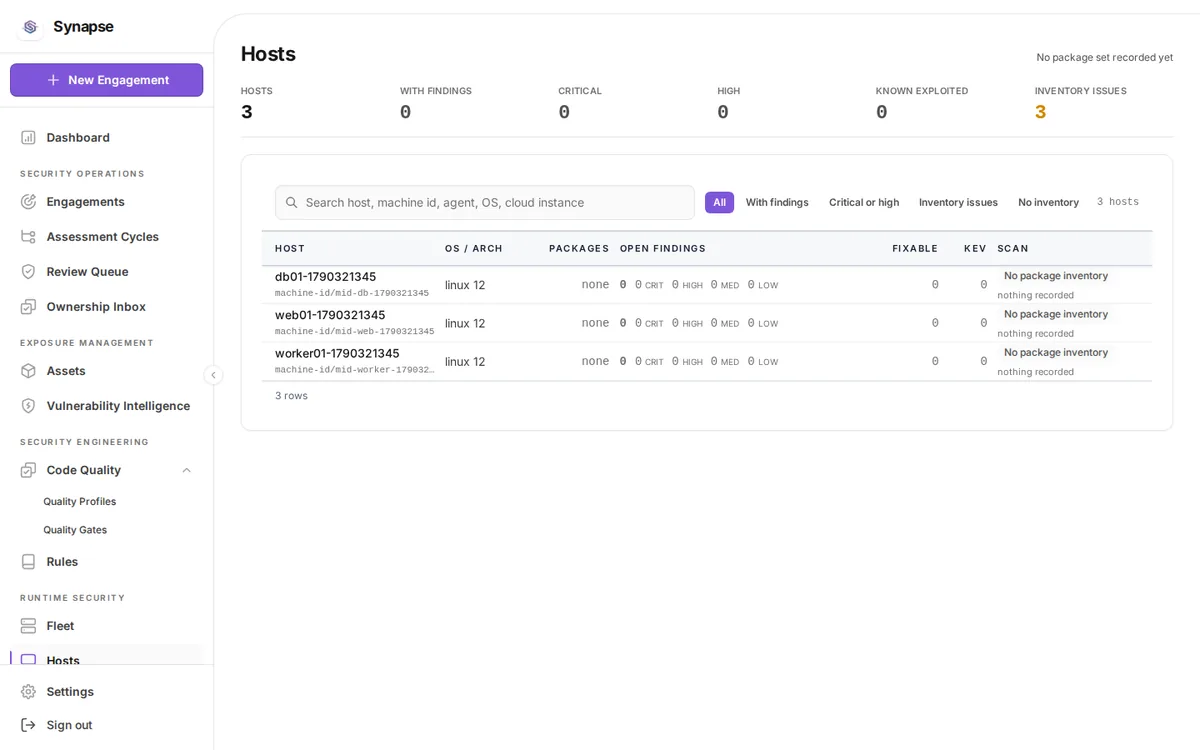
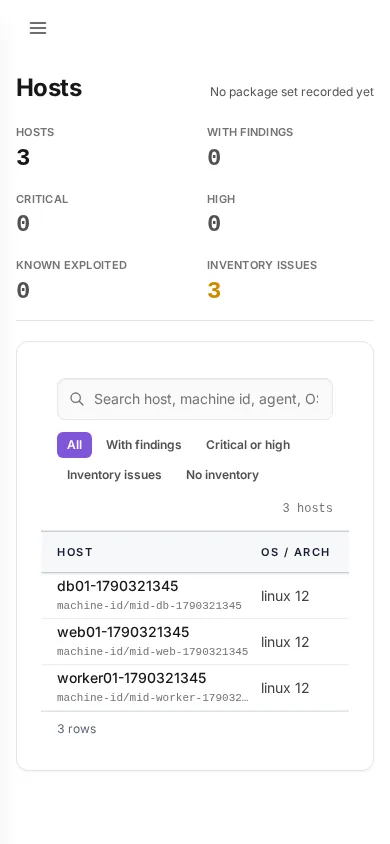
Hosts
/fleet/hosts
Host inventory from the agents, with per-host packages and CVEs.
- Search and filter the host list.
- Open a host for its packages and the CVEs matched against them.
Coverage windows
/fleet/coverage-windows
What an agent observed over a chosen span, used to retro-hunt collected telemetry.
- Enter an Asset id and an Agent id.
- Set the window.
Applyruns the hunt.
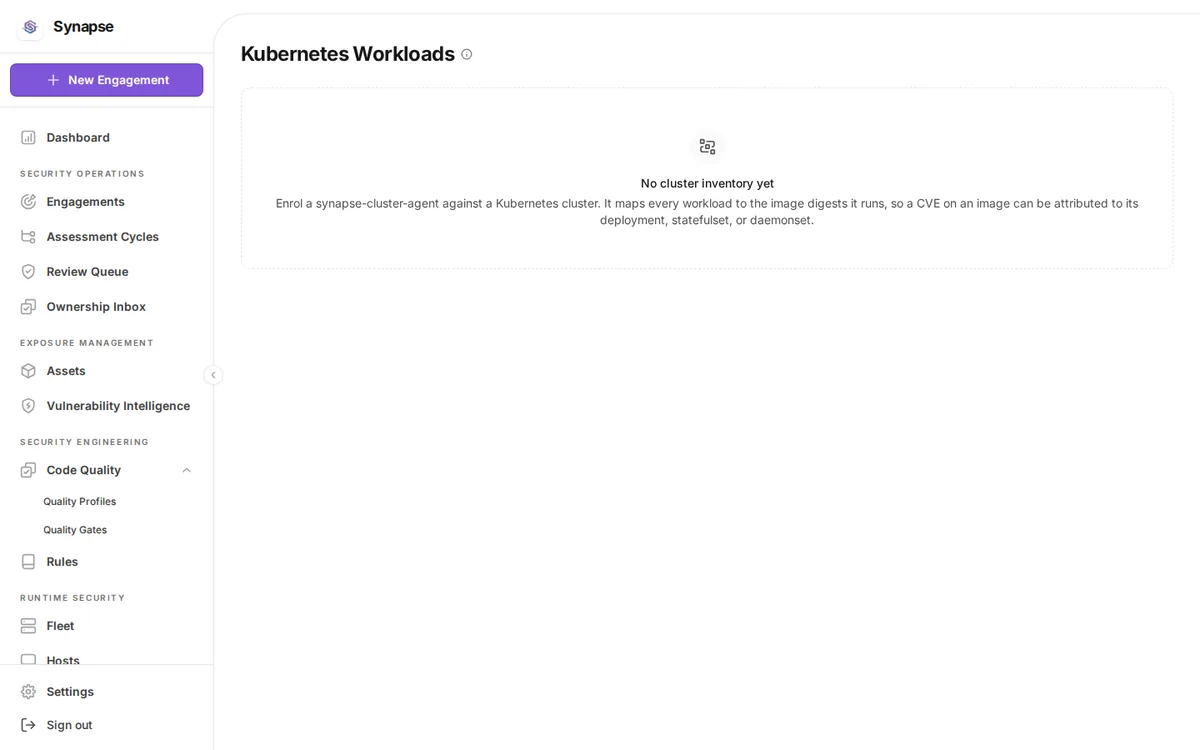
Kubernetes Workloads
/fleet/workloads
Cluster workloads the cluster agent reported, with their images and service accounts.
About workloadsexplains what the cluster agent collects and what it does not.- Read cluster, namespace, kind, name, service account and images.
Asset graph
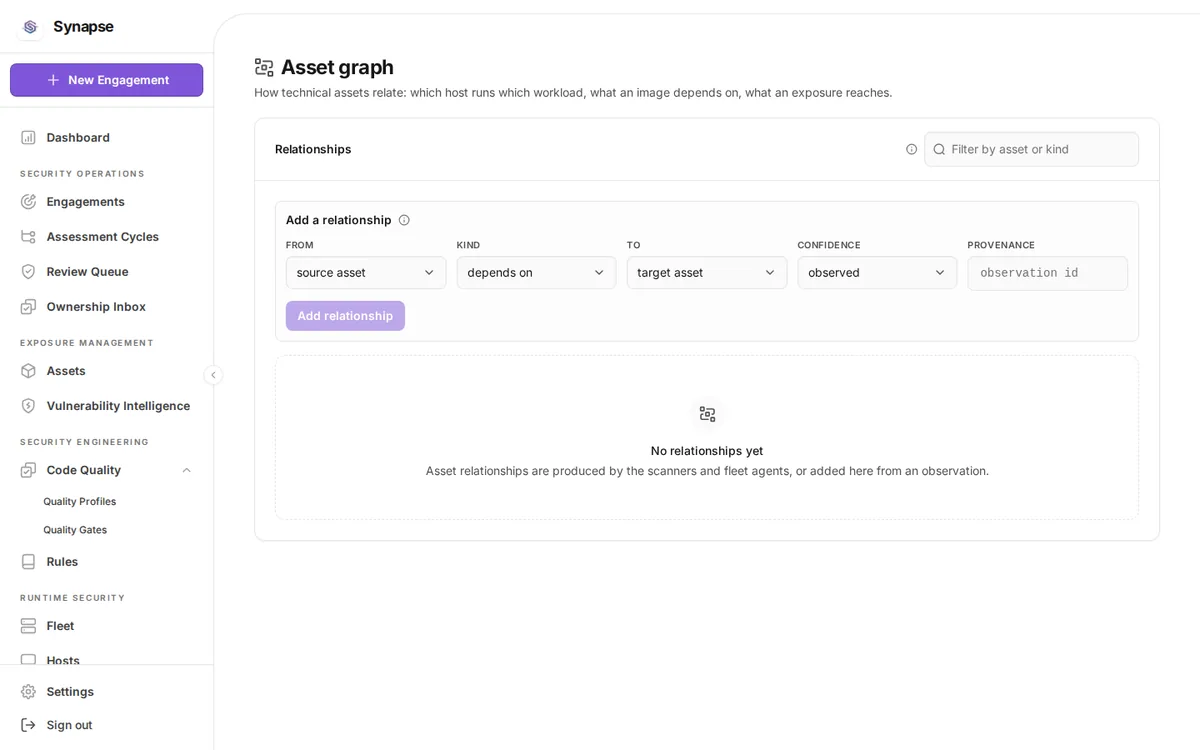
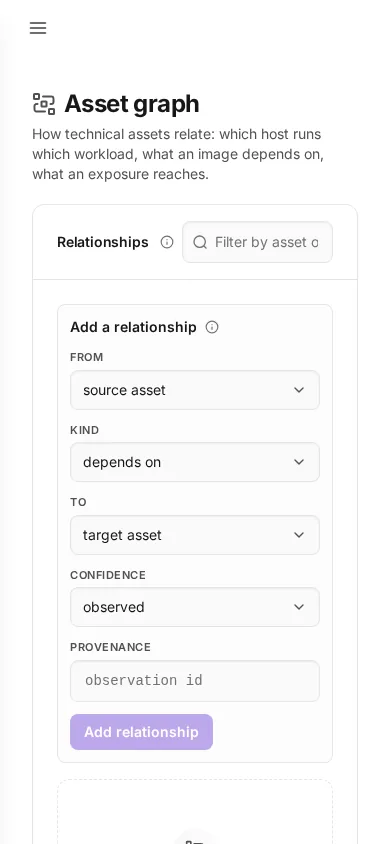
/fleet/asset-graph
How technical assets relate. Every edge carries provenance, so inferred is never shown as observed.
Observed vs inferredexplains the distinction the graph encodes.- Fill From, Kind, To, Confidence, Provenance.
Add relationshipcommits it; creation is idempotent on the natural key.
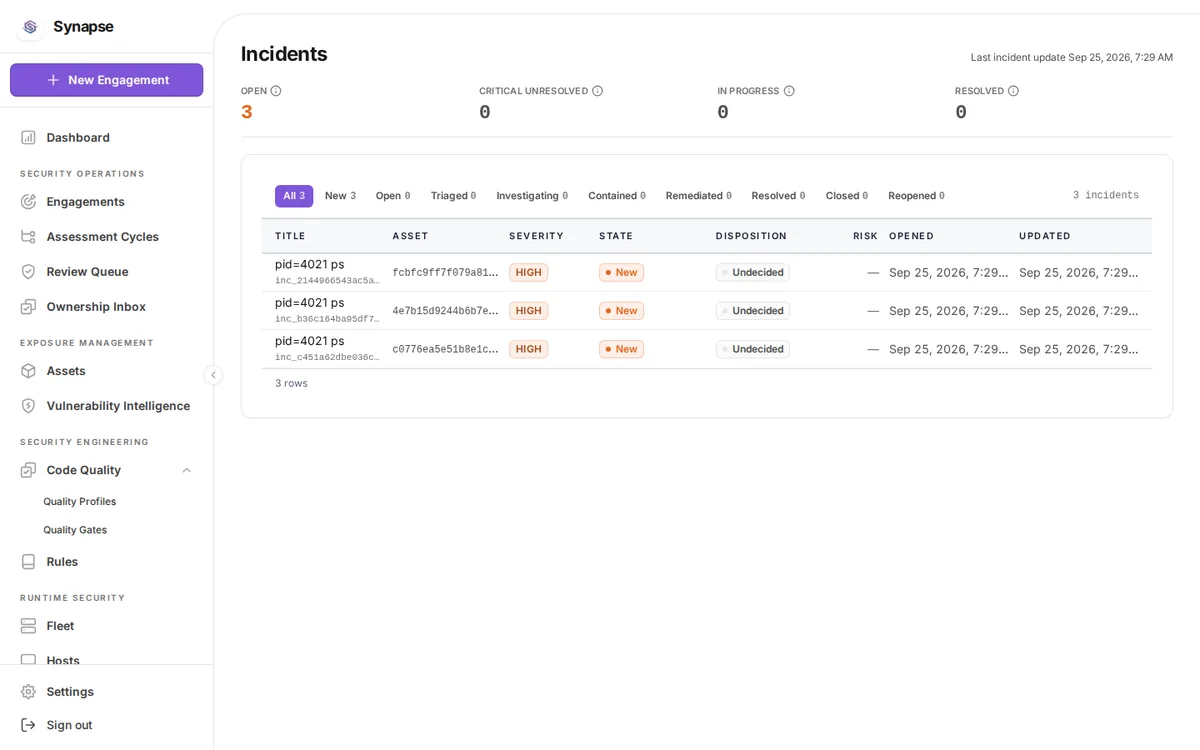
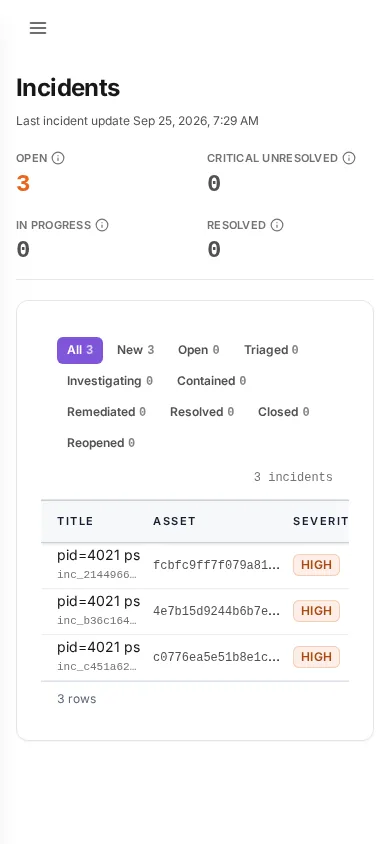
Incidents
/fleet/incidents
Runtime incidents raised from agent telemetry, tracked through their lifecycle.
- Read Open, Critical unresolved, In progress, Resolved.
- Filter by state: new, open, triaged, investigating, contained, remediated, resolved, closed, reopened.
- Open an incident for its timeline and the response actions taken.
Response operations
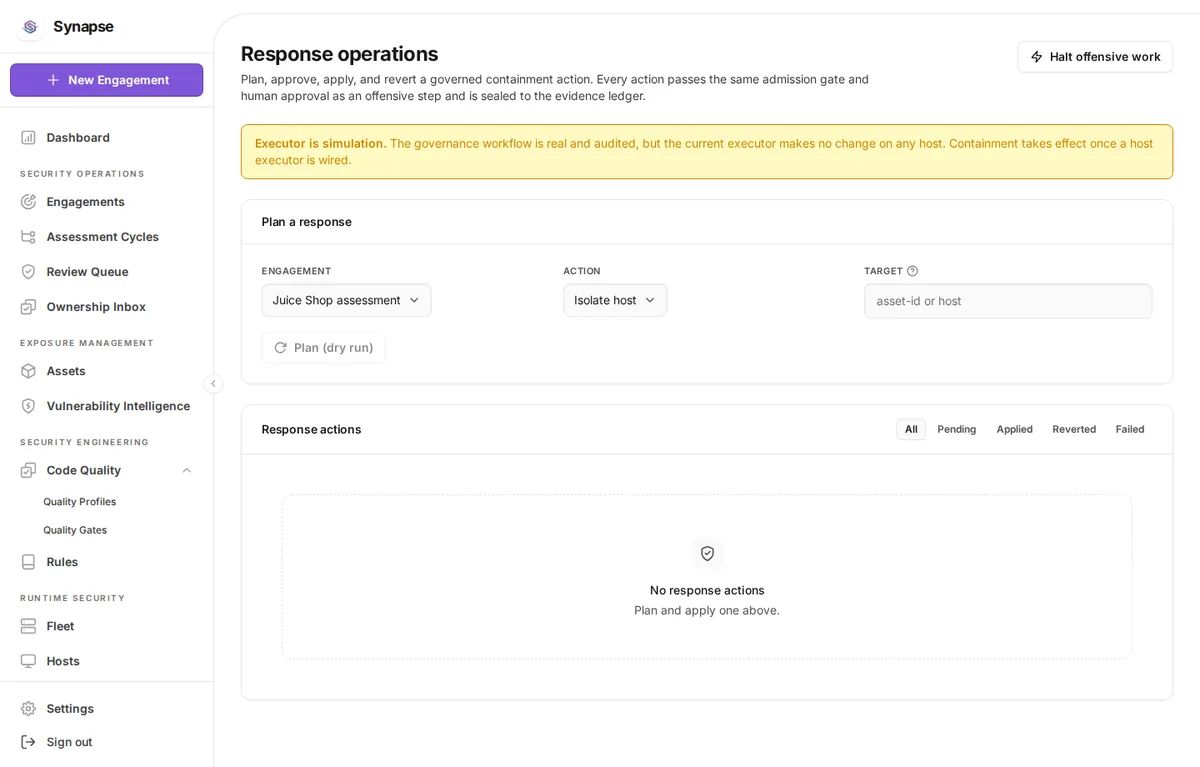
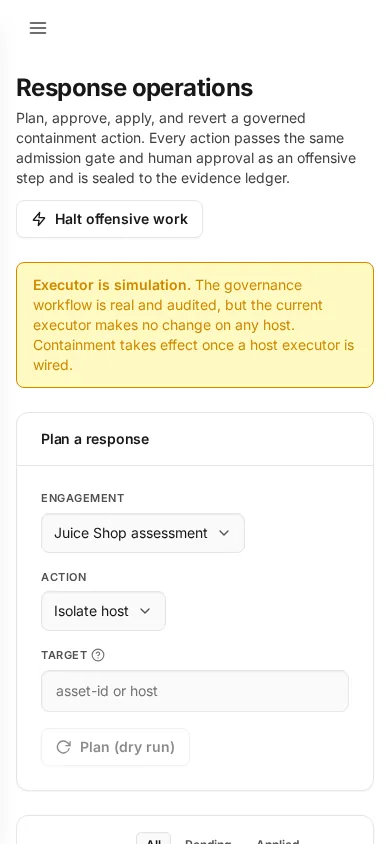
/blueteam/response
Defensive actions against a live target. Every action is planned as a dry run first.
- Pick the Engagement.
- Pick the Action and name the Target.
Plan (dry run)first; the plan is what you review before anything executes.- Follow the record list with
all/pending/applied/reverted/failed. Halt offensive workstops the engagement's offensive activity.
Settings
Audit trail
/settings
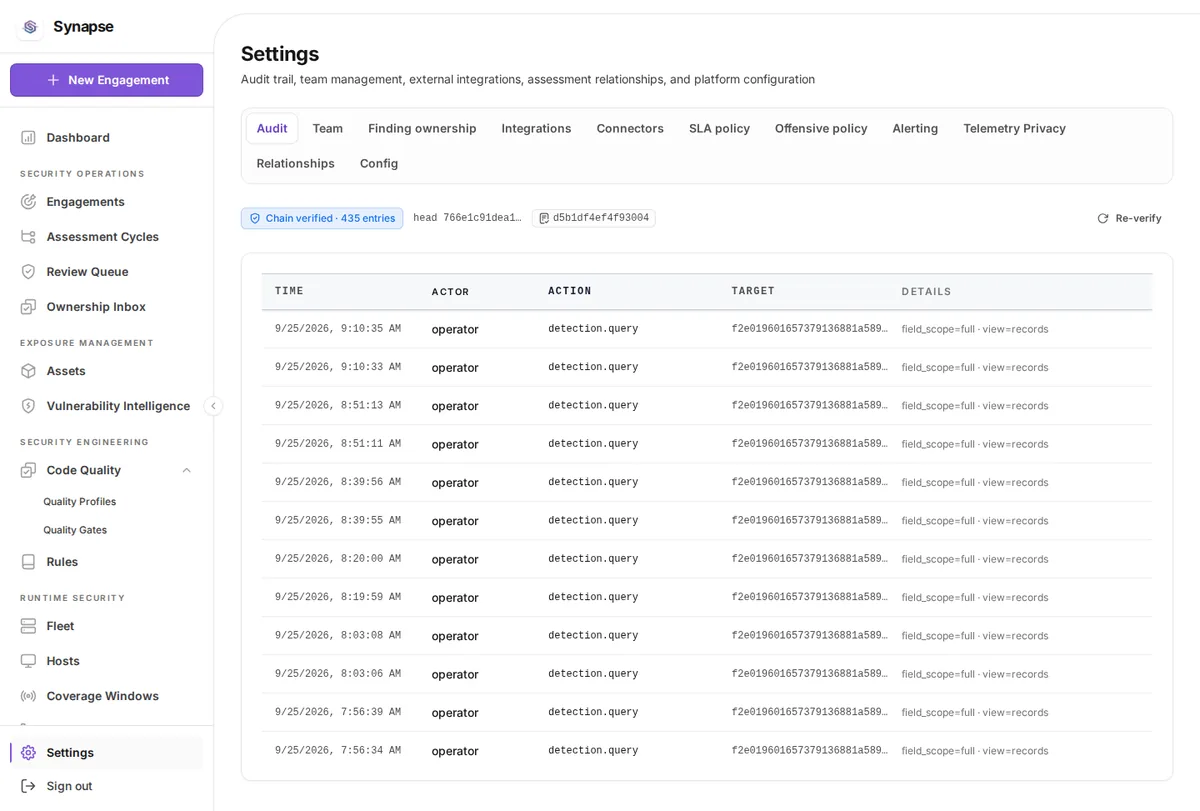
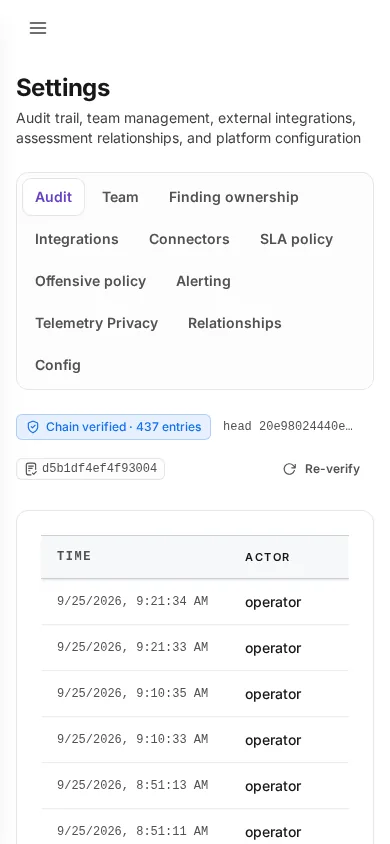
The audit log is hash-chained and append-only, and this screen can verify the chain.
- Read Time, Actor, Action, Target, Details.
Re-verifyre-walks the chain and reports whether it is intact, including unchained entries.
Team
/settings/team
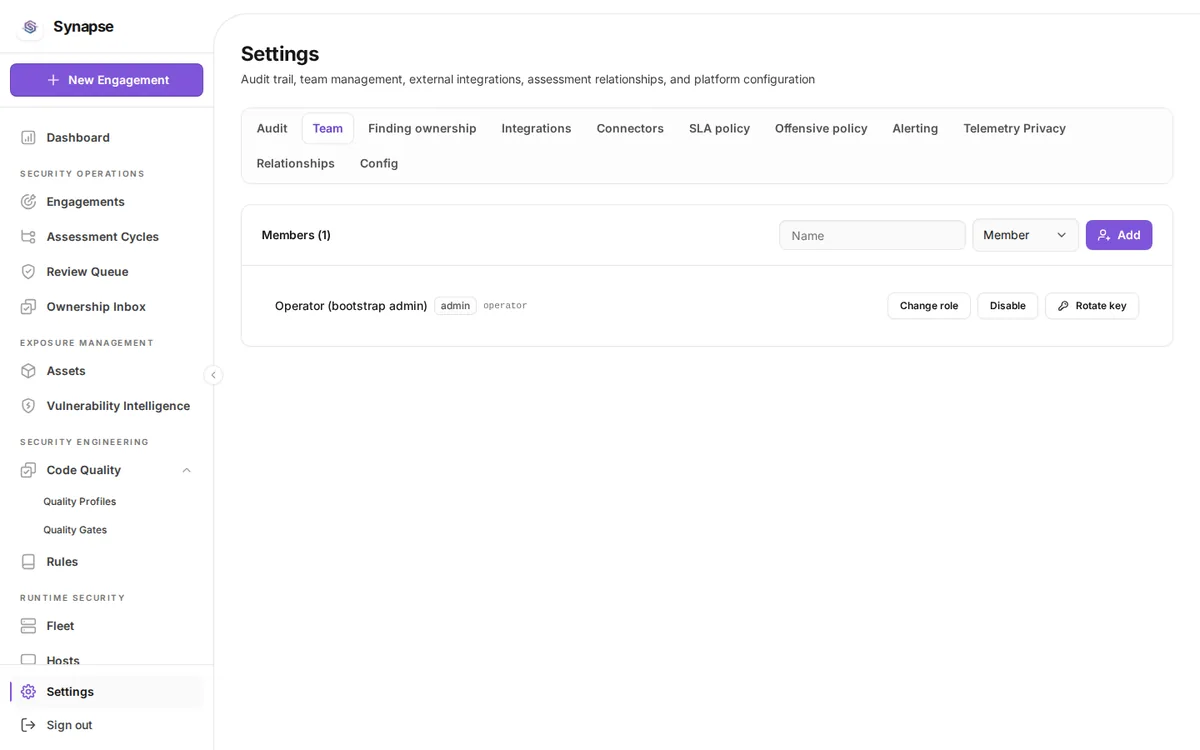
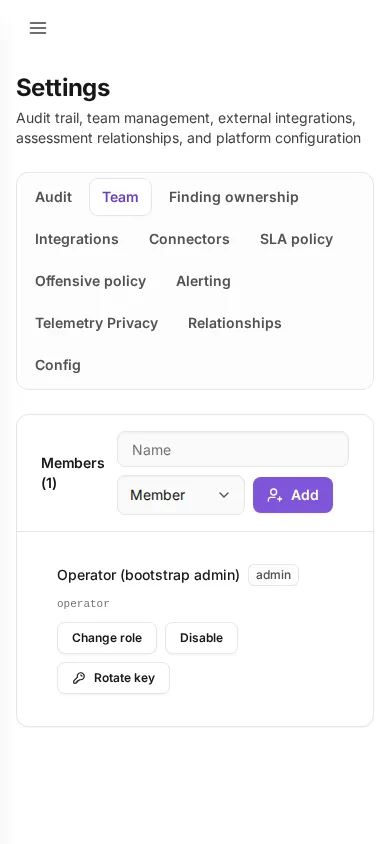
Who can sign in, what they can do, and their API keys.
- Type a name, pick a role, press
Add. The API key appears once. Change roleopens a radio group on the row; pick a role, thenSave role. Selecting alone does nothing, because a privilege change should not happen on a stray click.Disablerevokes access and keeps the account and its audit trail; it becomesEnable.Rotate keyissues a new key and stops the previous one immediately.- A failed action is written on the row, not only in the toast.
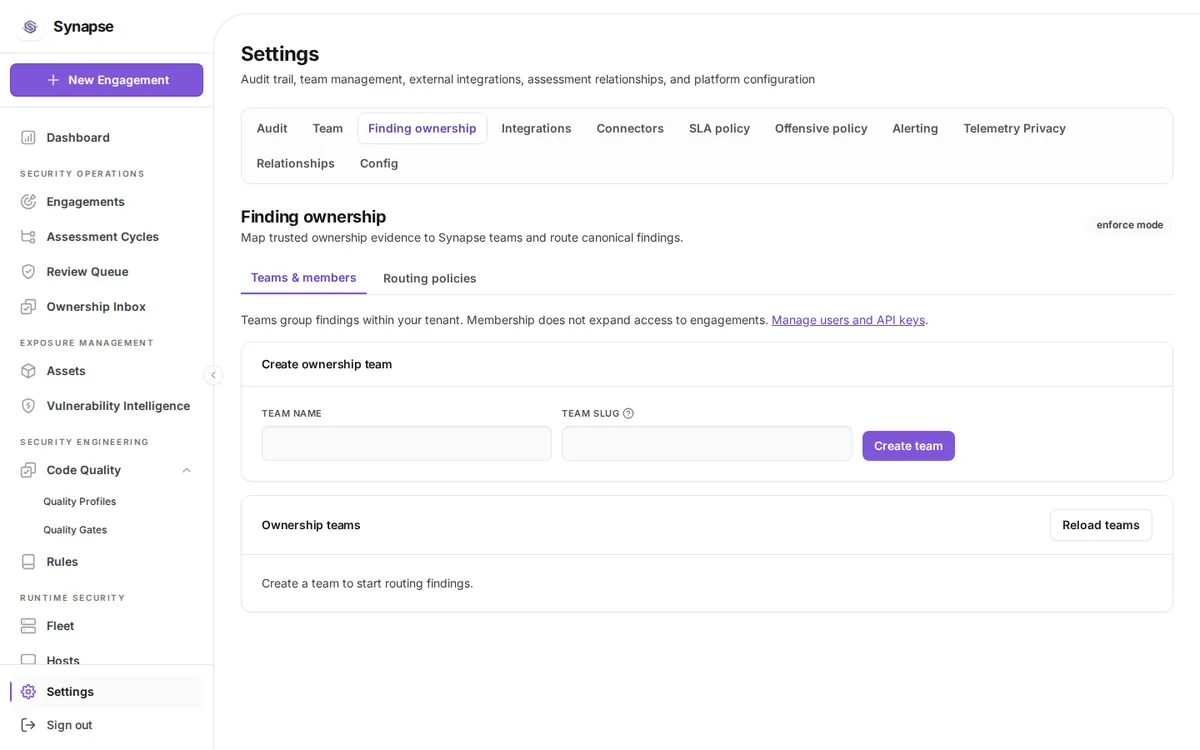
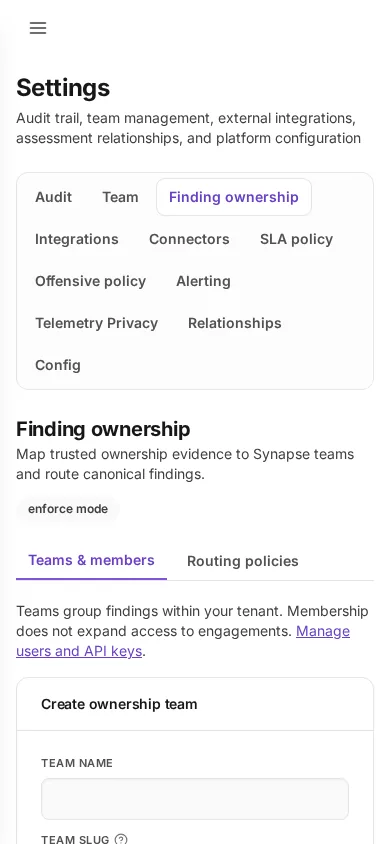
Finding ownership
/settings/ownership
Teams, members and the routing policy that decides which team owns a finding.
- Define teams and members.
- Map repositories and assets to teams.
- Author a policy version, preview it against real findings, then activate the version you reviewed.
Integrations
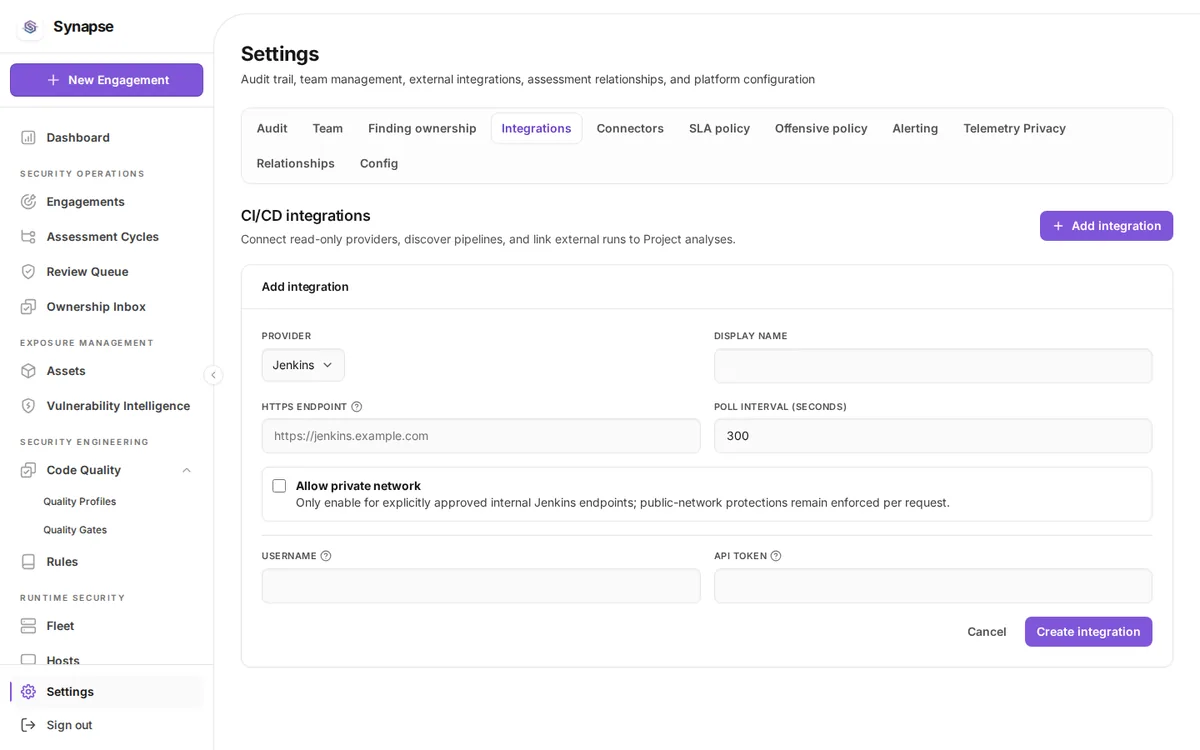
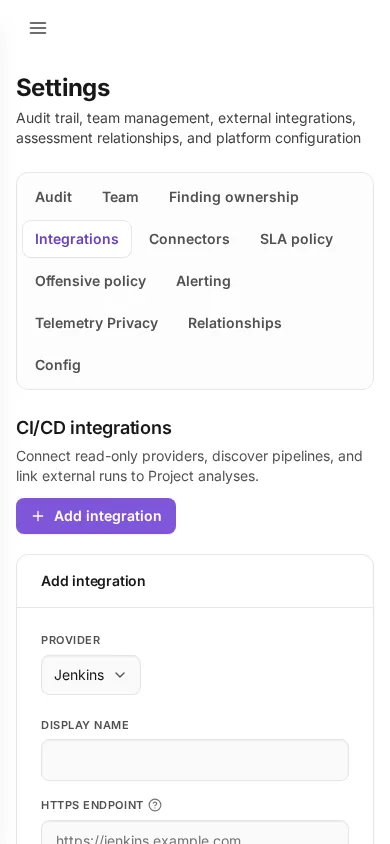
/settings/integrations
Outbound systems Synapse talks to, and whether each is enabled.
- Add an integration and supply its credential; secrets go to the vault.
- Enable or disable one without deleting it.
- Check its bindings to see what it is wired to.
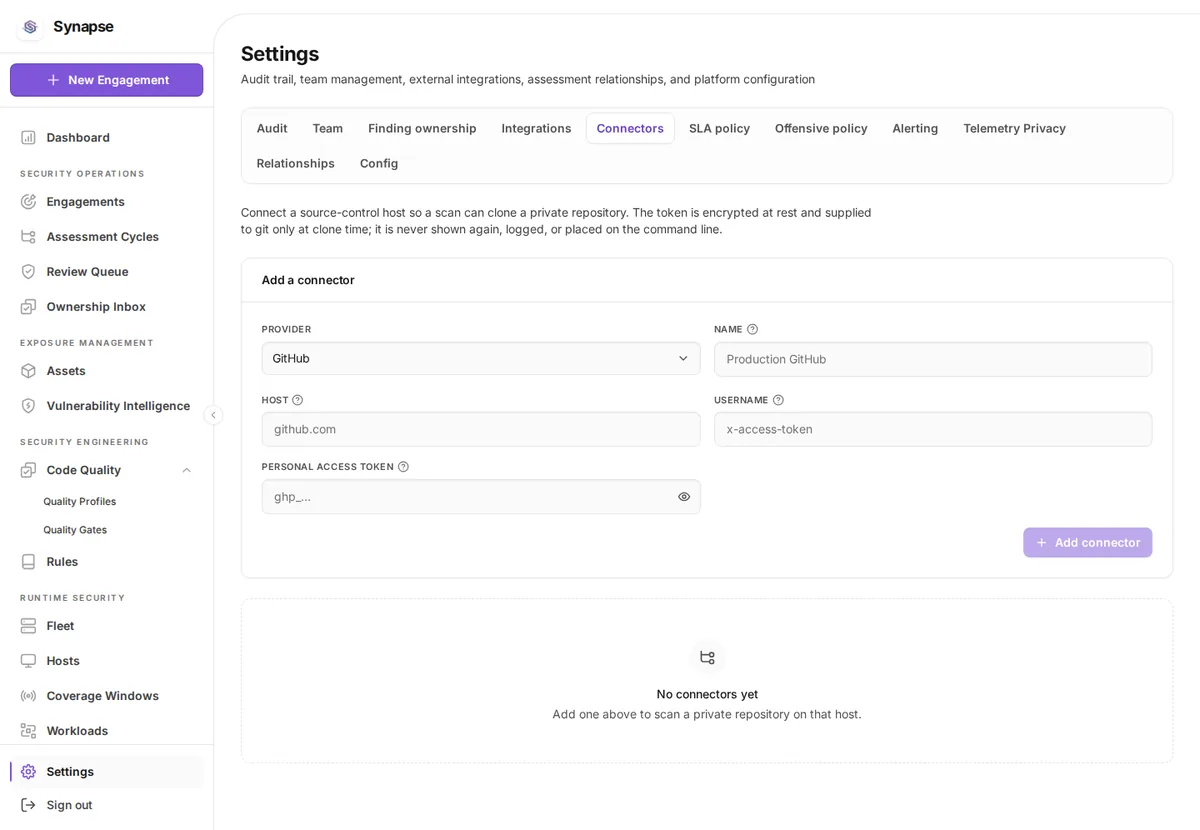
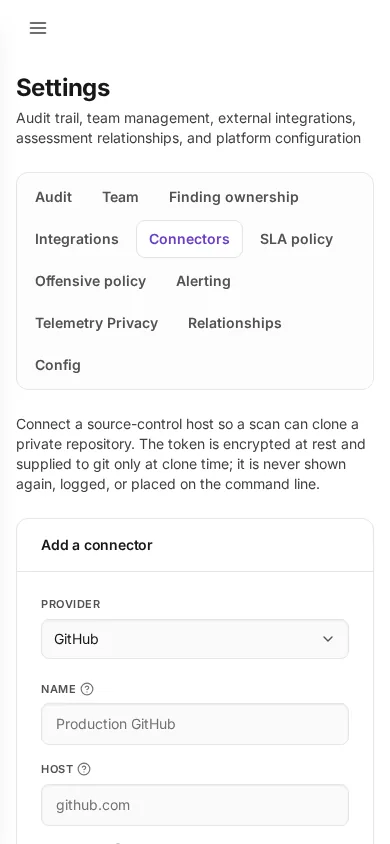
Connectors
/settings/connectors
Source-control hosts a scan can clone a private repository from.
- Pick the Provider, then fill Name, Host, Username and the Personal access token.
- The token is encrypted at rest and supplied to git only at clone time.
Add connectorsaves it.
SLA policy
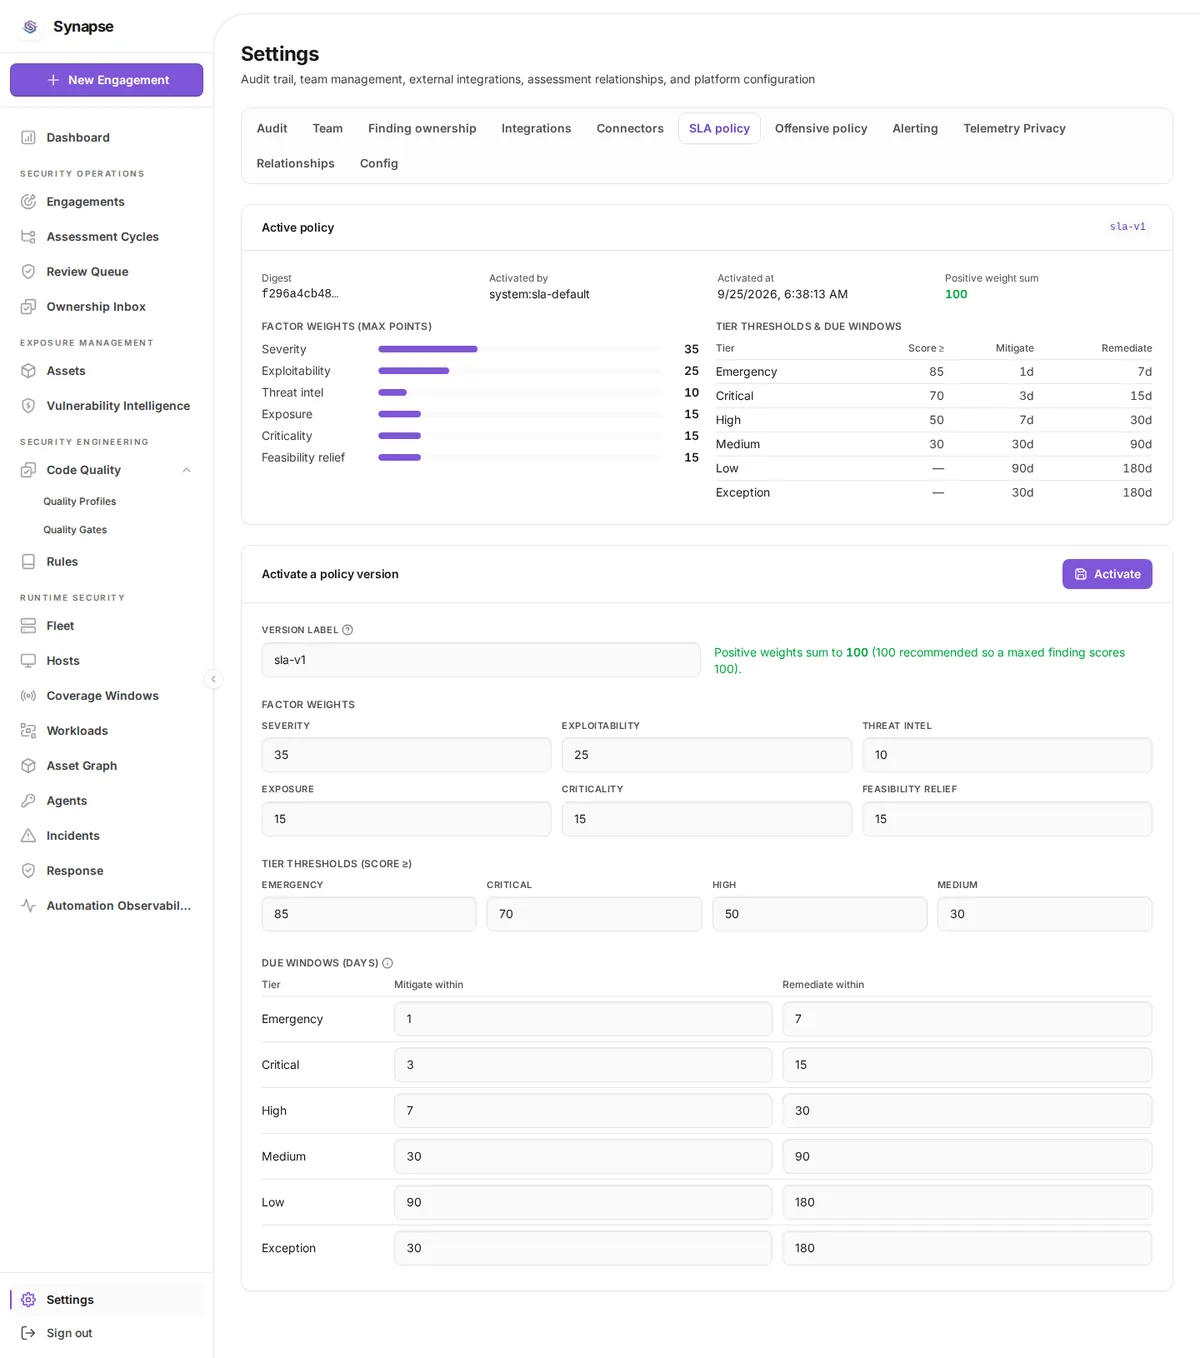
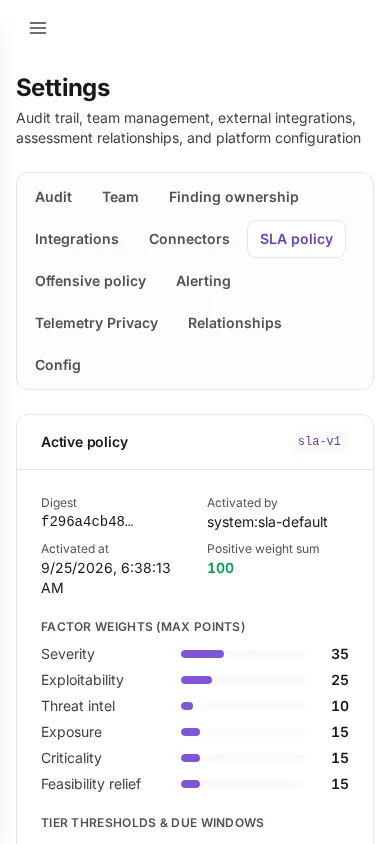
/settings/sla
How a finding's remediation deadline is computed. The policy is versioned.
- Set the Version label.
- Set Factor weights: severity, exploitability, threat intel, exposure and the rest.
- Set Tier thresholds & due windows: Tier, Score ≥, Mitigate, Remediate.
Activatemakes this version the one new assessments use; existing findings are unchanged until reassessed.
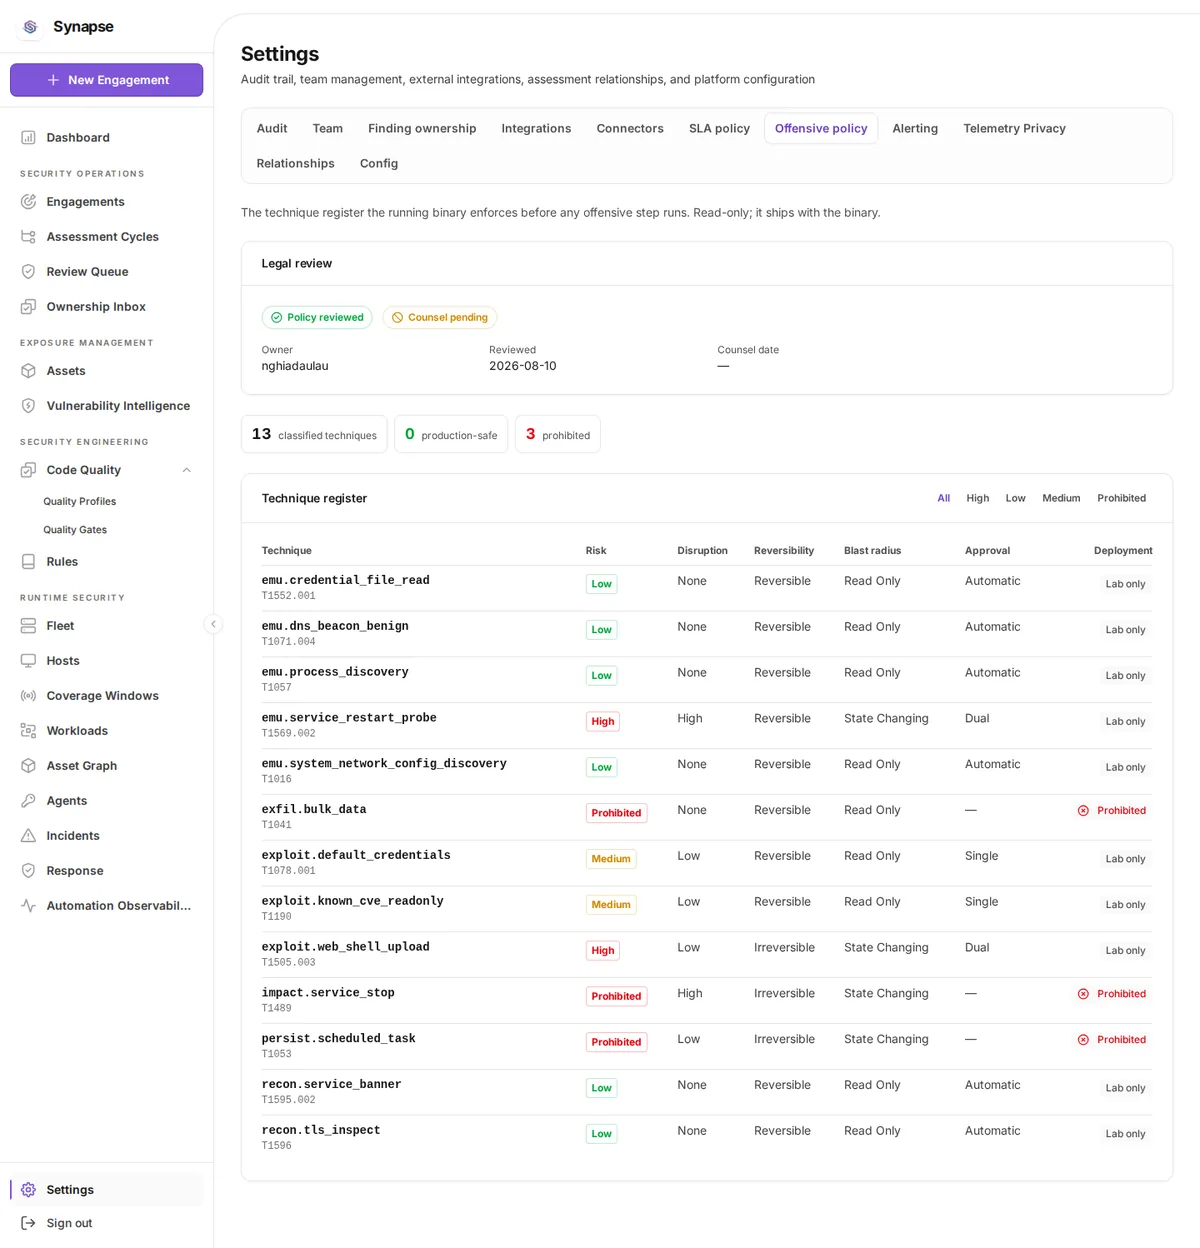
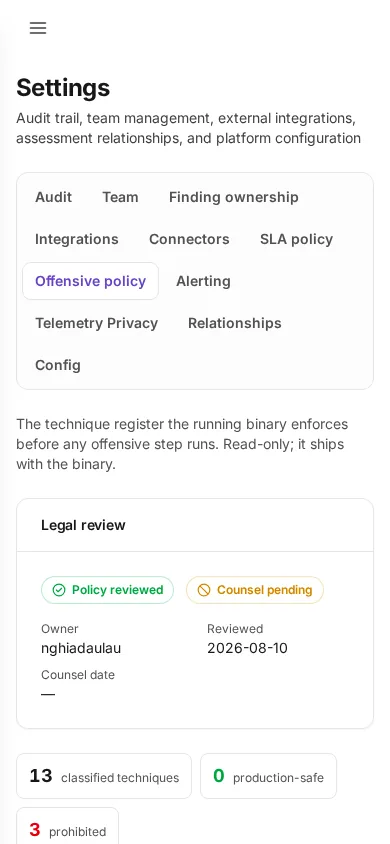
Offensive policy
/settings/offensive-policy
What offensive tooling is permitted and under what authorization.
- Set the policy for the tenant.
- Save it; the change lands in the audit trail.
Alerting
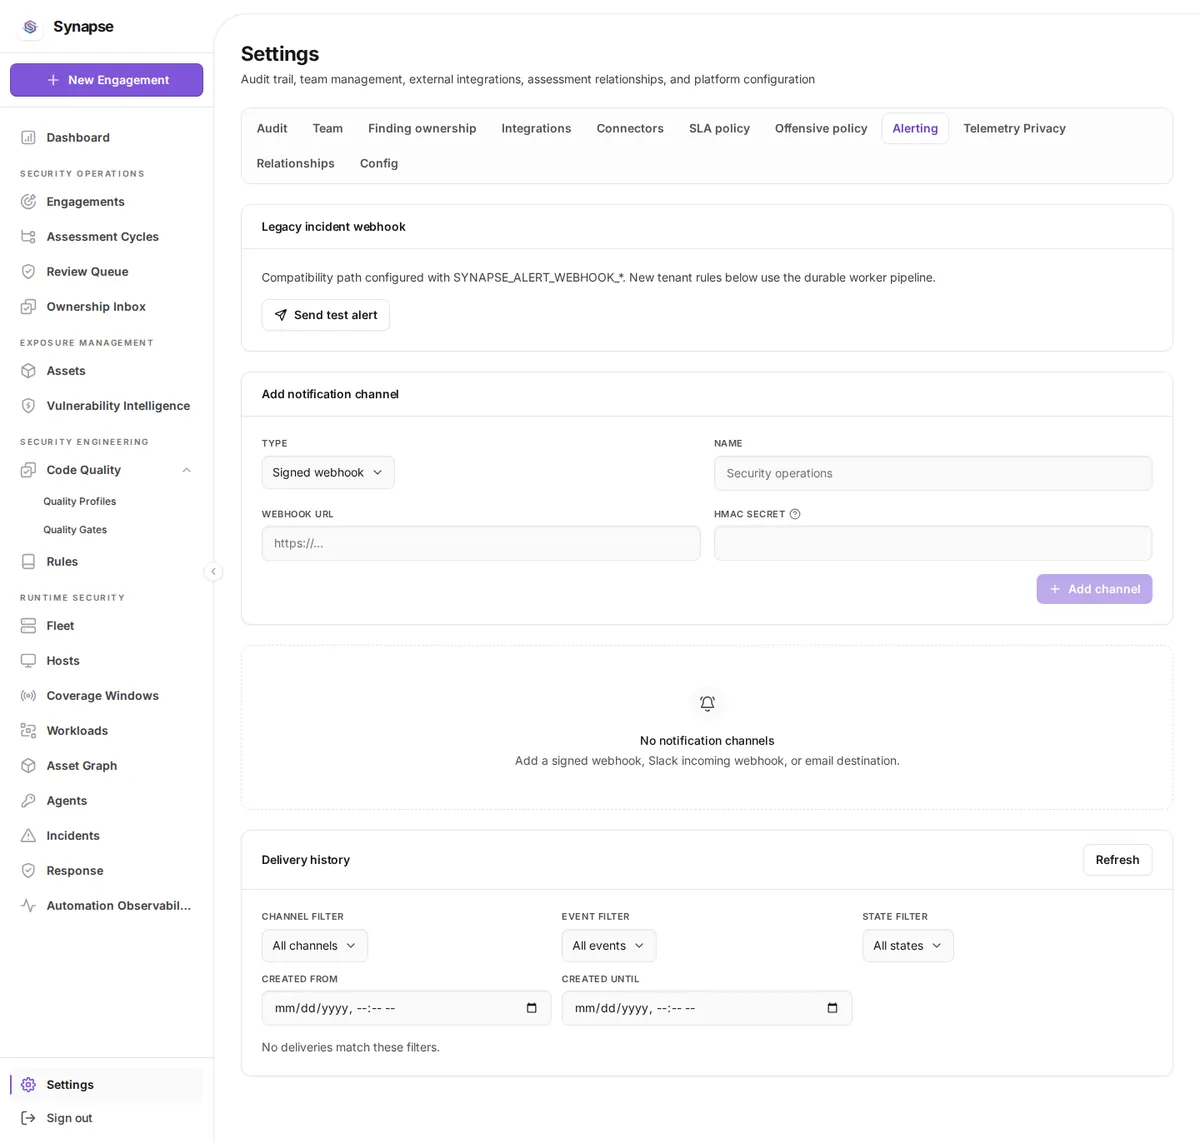
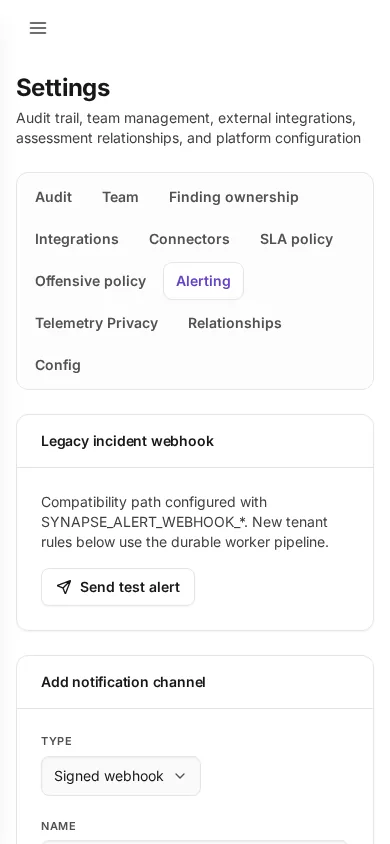
/settings/alerting
Where notifications go, which events trigger them, and what was delivered.
Add channel, choose Type (signed webhook, Slack incoming webhook, or email), and set Name. A signed webhook needs a Webhook URL and HMAC secret; Slack needs its incoming webhook URL; email needs Recipients.- Add rules mapping events to channels.
- Click
Teston a channel row. This queues a test delivery for that channel; the returned delivery ID andpendingstate do not mean the receiver acknowledged it. - Review delivery history using the channel / event / state filters. Open the delivery to inspect its attempts and confirm whether it was delivered.
The separate Send test alert button under Legacy incident webhook tests only the
compatibility webhook configured with SYNAPSE_ALERT_WEBHOOK_*; it does not test tenant-managed
channels.
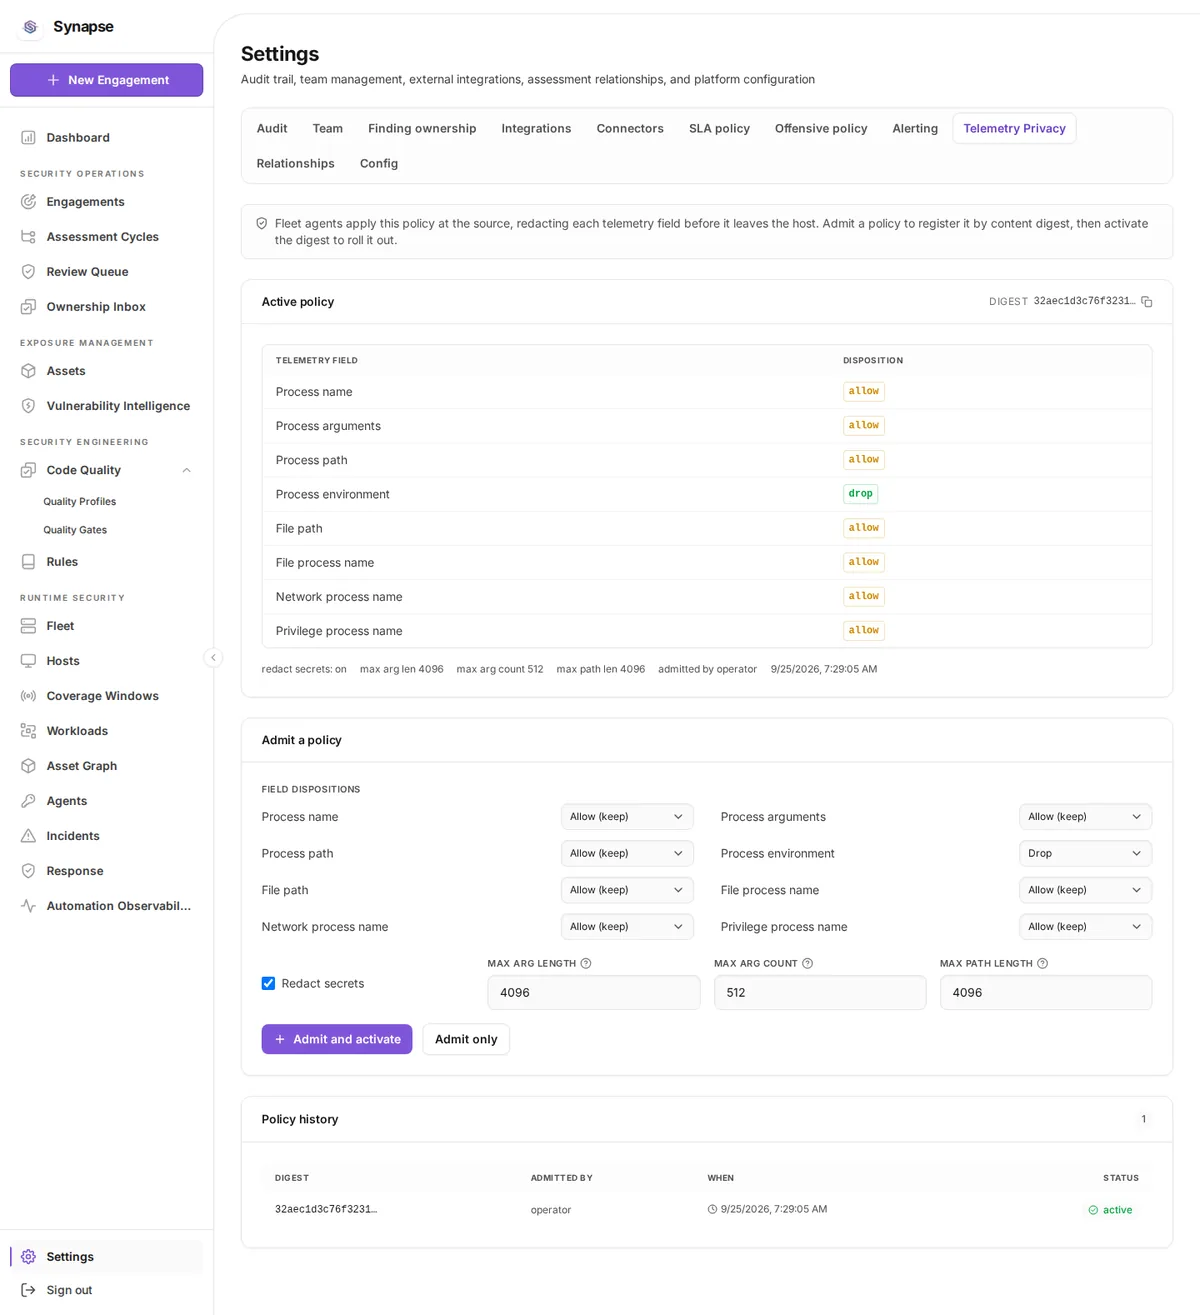
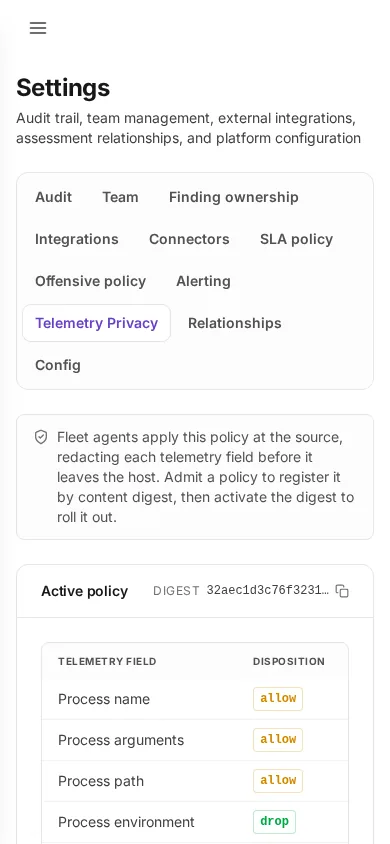
Telemetry privacy
/settings/privacy
What agent telemetry is retained and what is redacted before storage.
- Read the active policy.
- Change what is collected and redacted, then save a new version.
Relationships
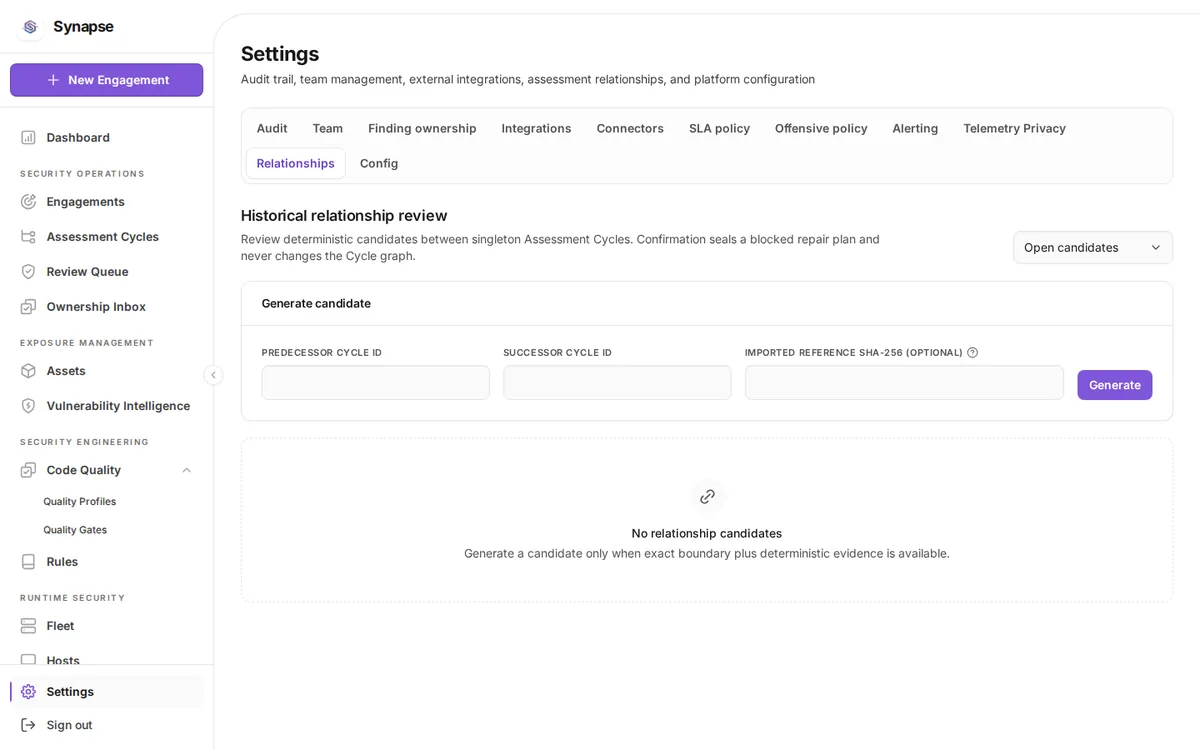
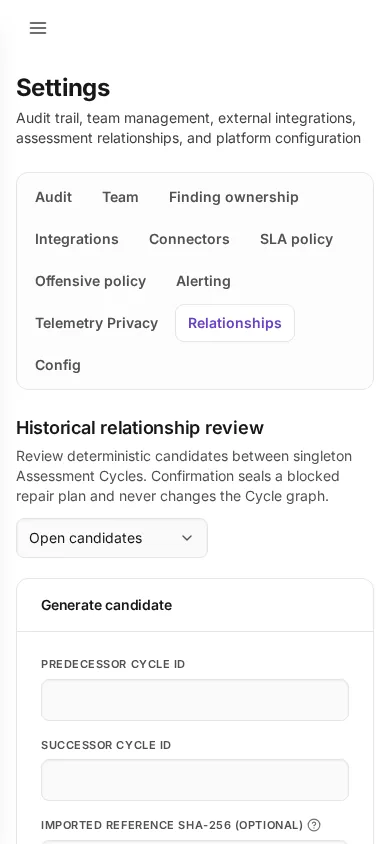
/settings/relationships
Proposed links between assessments, reviewed before they are committed.
- Read each candidate and its evidence.
- Preview the change, then commit the preview you reviewed.
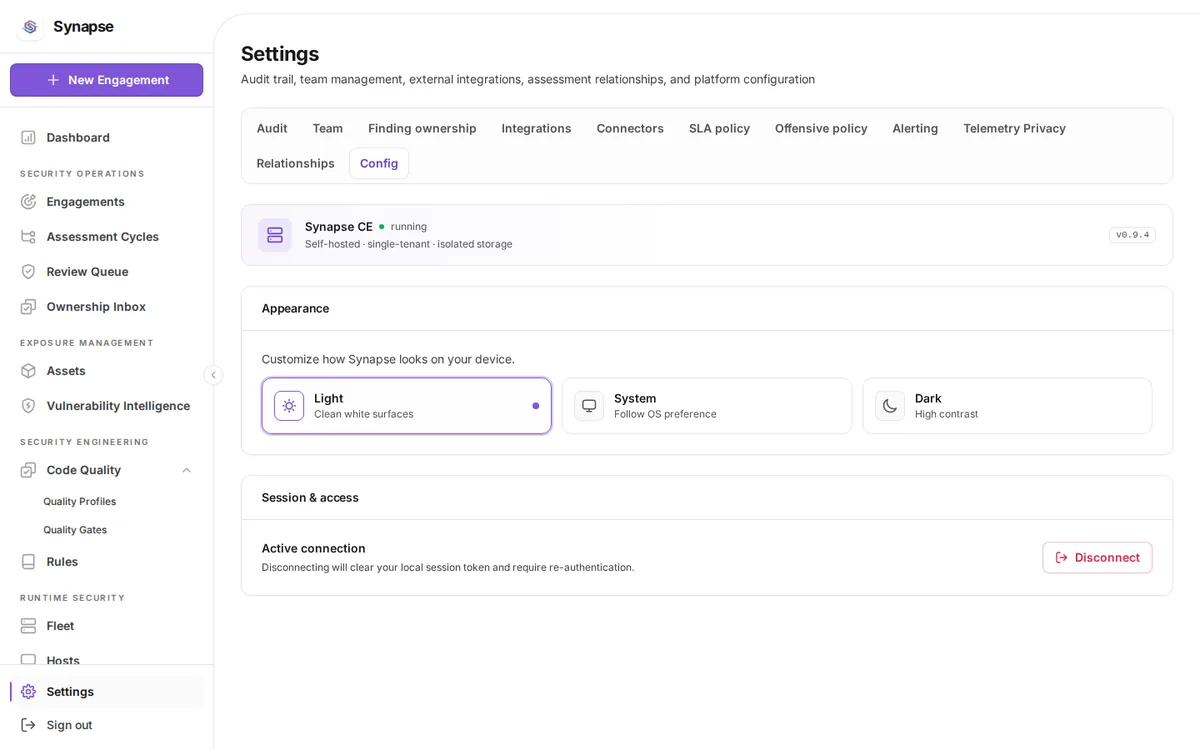
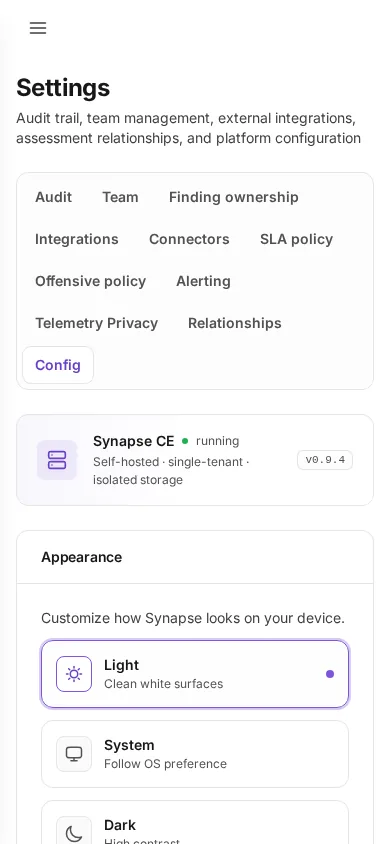
Config
/settings/config
Per-person preferences and the session.
- Pick
Light,SystemorDark. Disconnectends the session.
Engagement detail
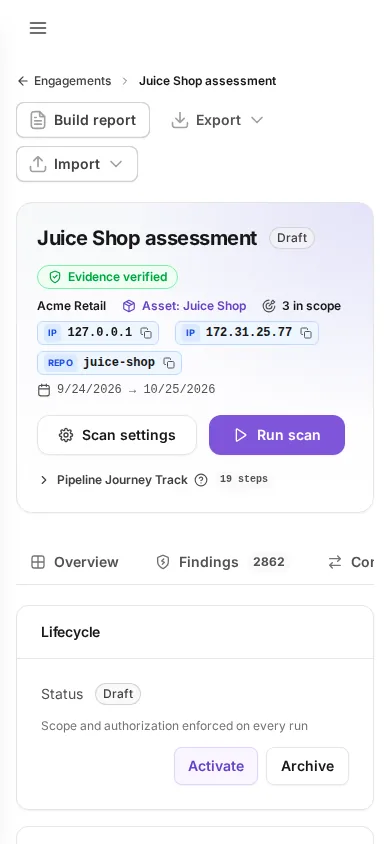
/engagements/{id}/{tab}: twenty-eight tabs in five groups. The header carries Build report,
Export, Import, Scan settings and Run scan on every tab, and the scan panel shows the
pipeline stages with their timings.
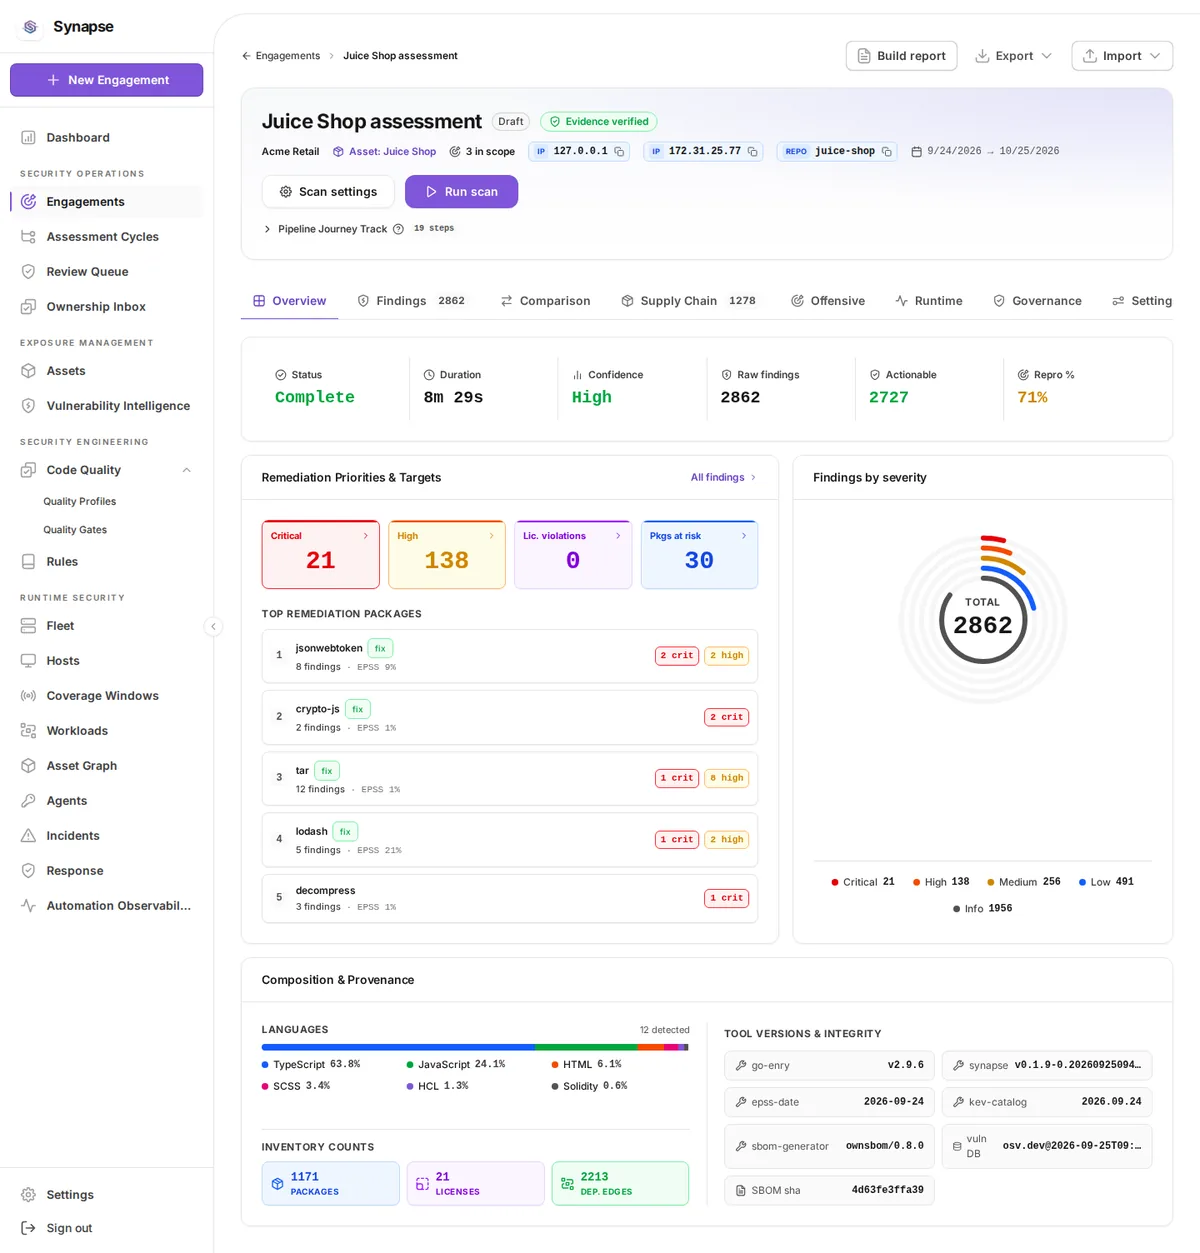
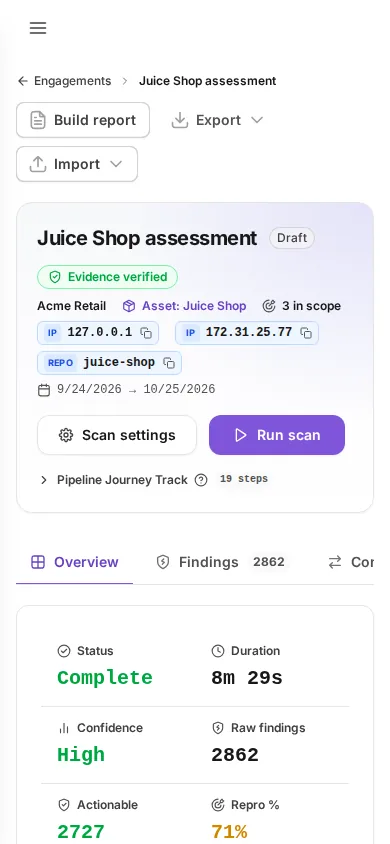
Overview
/engagements/{id}/overview
Scan health, the pipeline journey with per-stage timings, risk analysis and inventory counts.
- Read the header: status, the asset, how many targets are in scope, and the authorization window.
- Press Run scan to start one, or Scan settings to choose the mode and which analyzers run.
- Expand Pipeline Journey Track to see every step of the last scan with its counts and duration; a step that failed says why here.
- A banner above the tabs reports an incomplete inventory, for example a manifest that could not be resolved. Treat it as an unresolved result, not a clean one.
- Build report renders from stored data only; Export and Import move a CI bundle in and out.
Findings
/engagements/{id}/findings
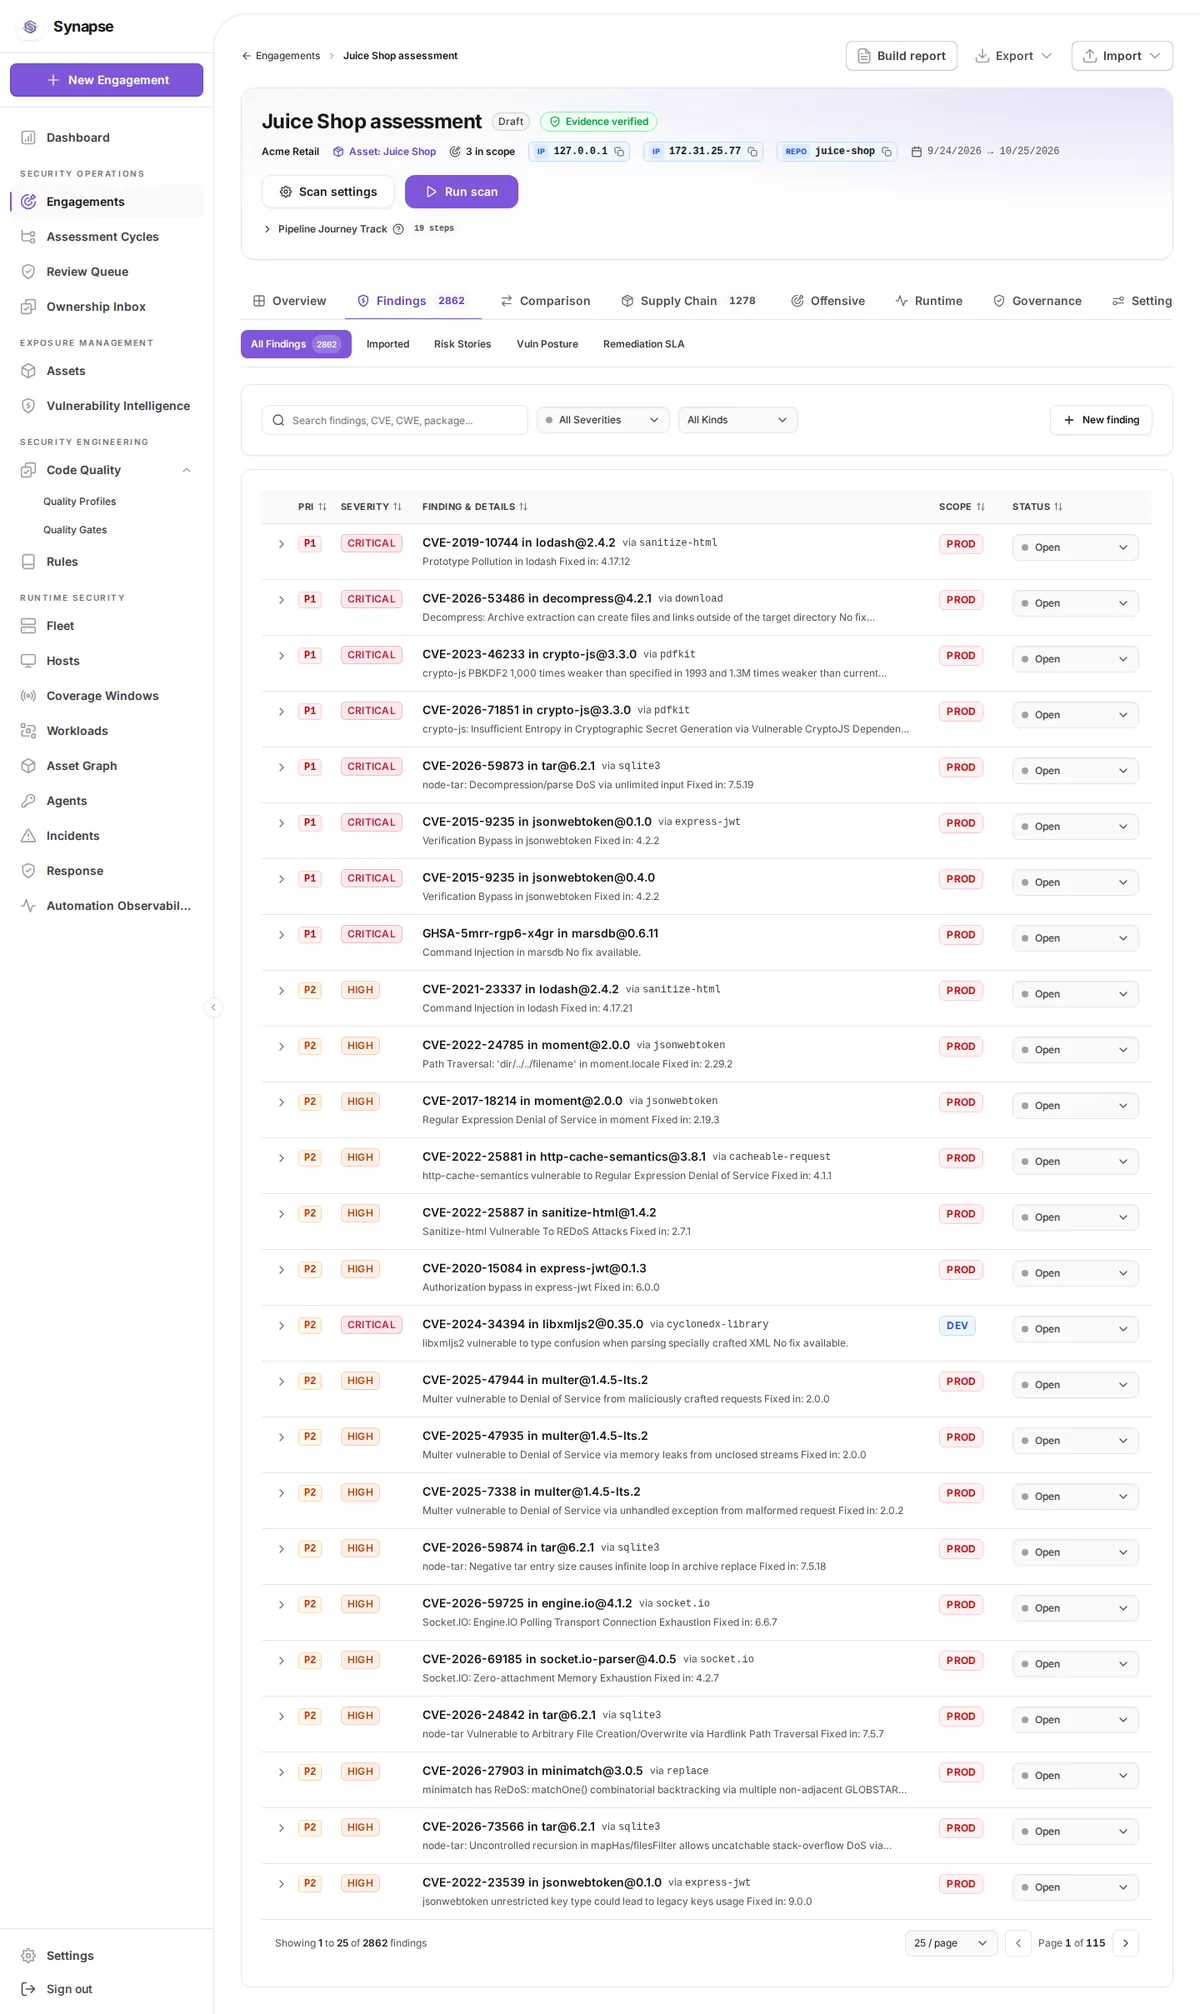
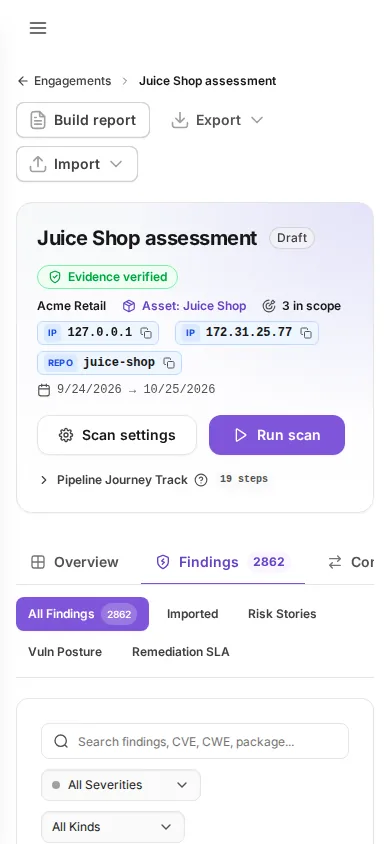
Every finding, ranked. Columns: Pri, Severity, Finding & Details, Scope, Status.
- Filter by severity, kind, status and producer; the search box matches title, rule and path.
- Sort by pressing a column header. The page size control offers 25, 50 or 100.
- Open a finding to read its evidence, its judgment history, and the retests recorded against it.
- Change status or severity from the finding, and record the reason; the change is written to the append-only audit log.
- The count beside the tab is the filtered total, so it moves as you narrow.
Imported
/engagements/{id}/imported
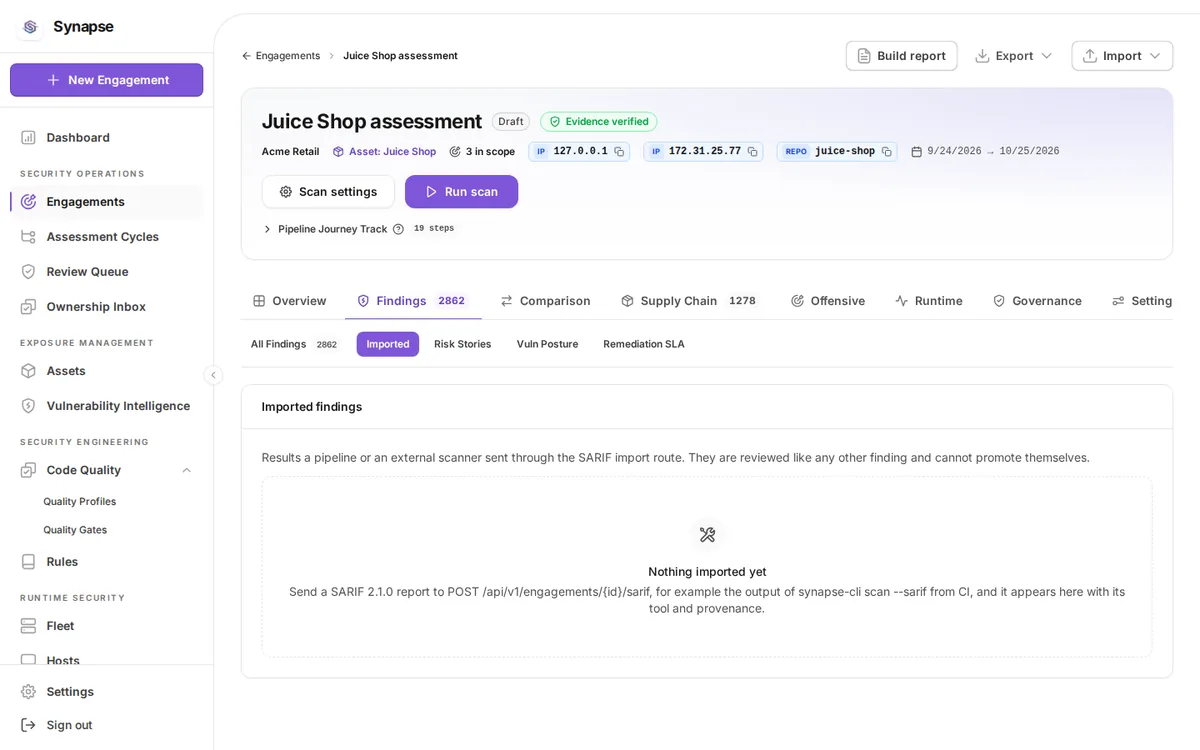
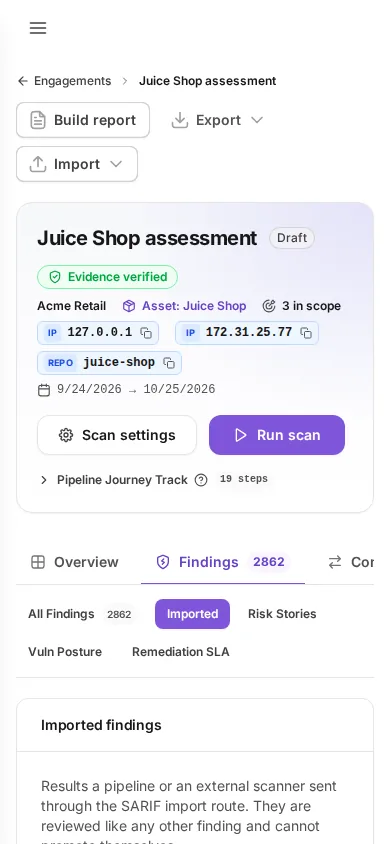
Findings ingested from another tool, kept distinct from what Synapse detected.
- This tab holds third-party findings brought in as SARIF, kept apart from what Synapse produced so provenance stays clear.
- Read the import summary for what was accepted and what was refused.
synapse-cli validate-sarifreports what the server would accept without writing anything; use it before importing.- Nothing here is merged into the native finding set; it is governed separately.
Comparison
/engagements/{id}/comparison
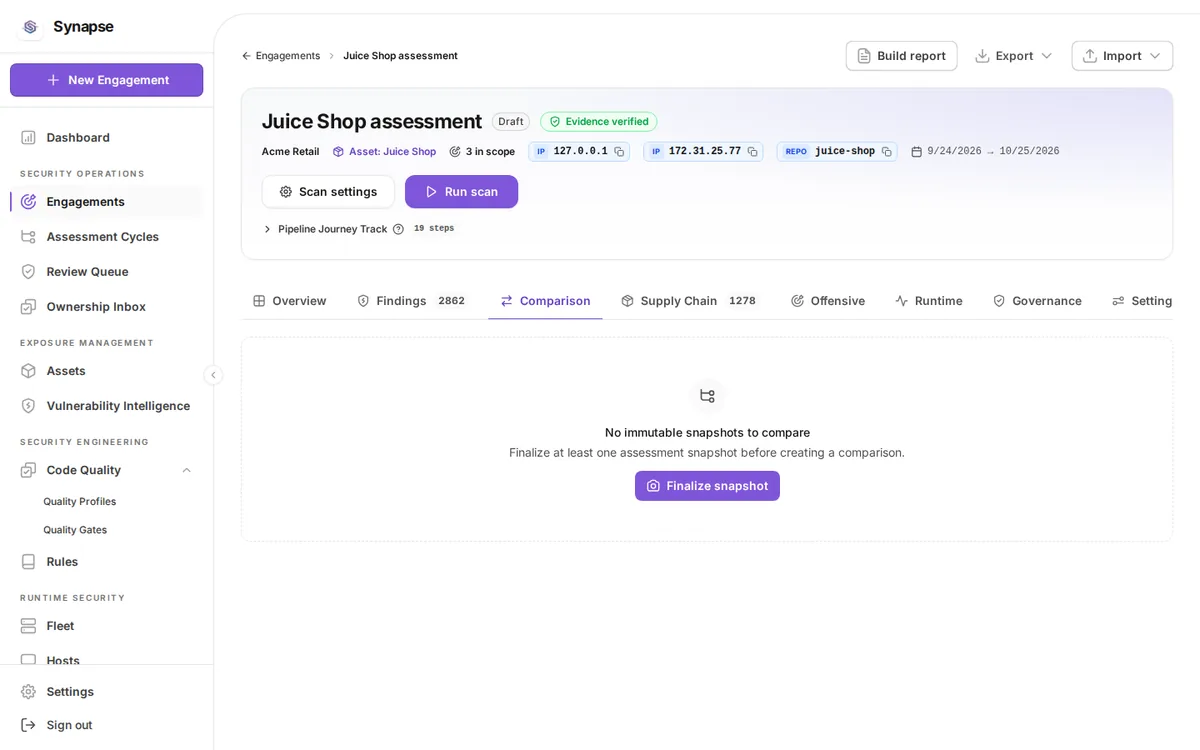
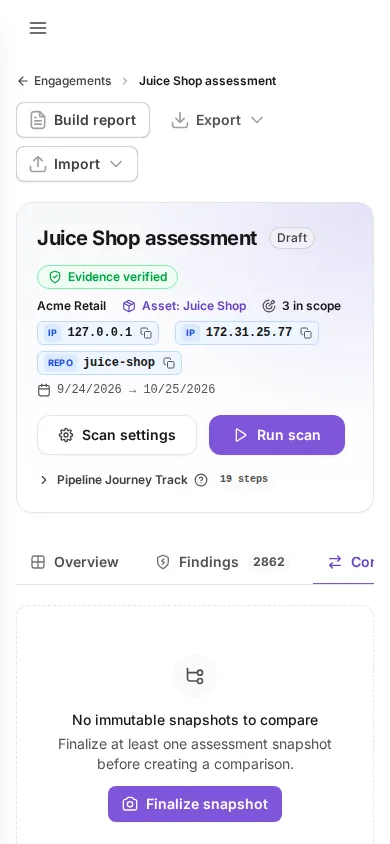
Two immutable snapshots compared. Finalize snapshot creates one from selected scan runs.
- Press Configure comparison and choose two finalized snapshots: a baseline and a current.
- Pick the scope, which decides whether the comparison covers all findings, security findings only, or vulnerabilities only.
- Press Run comparison. The result is immutable and addressed by its own id, so the same link always shows the same answer.
- Read the ratios first: new, fixed, unchanged, and the ones that could not be compared.
- Filter the compared findings by presence, severity, change flag and review state, then open one to see both observations side by side.
- An Assessment in no Cycle can still compare its own snapshots; the Cycle only adds sibling Assessments as baselines.
Remediation SLA
/engagements/{id}/sla
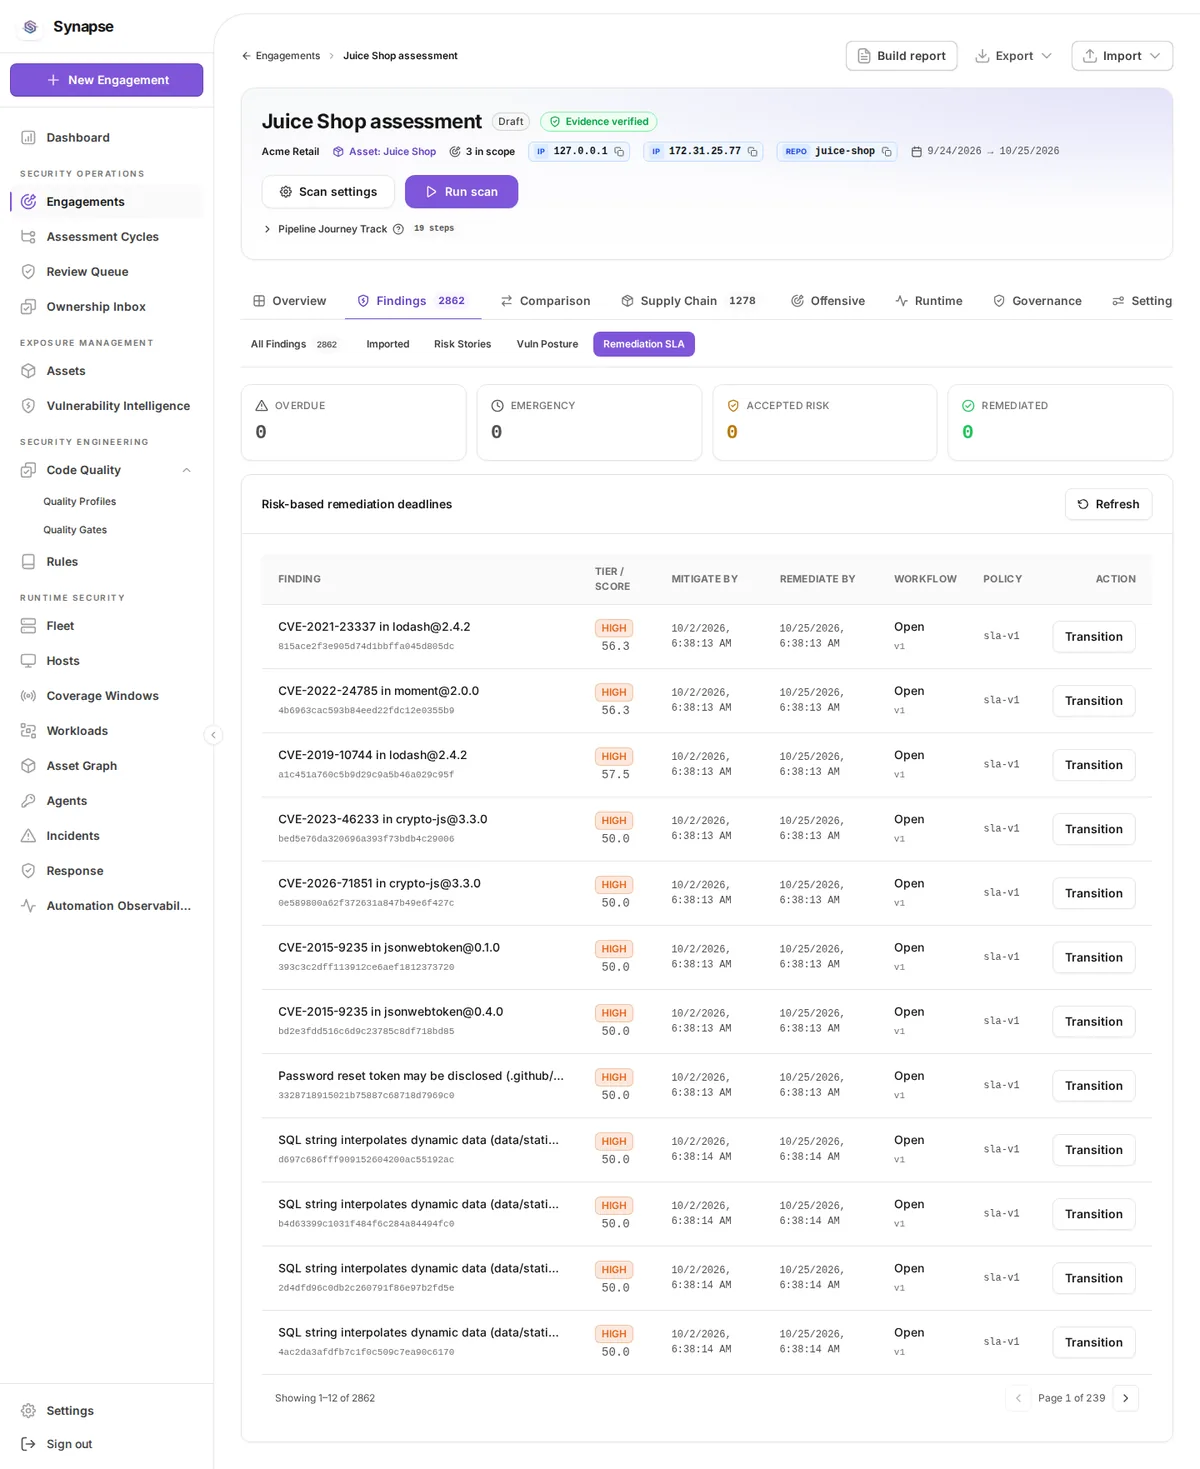
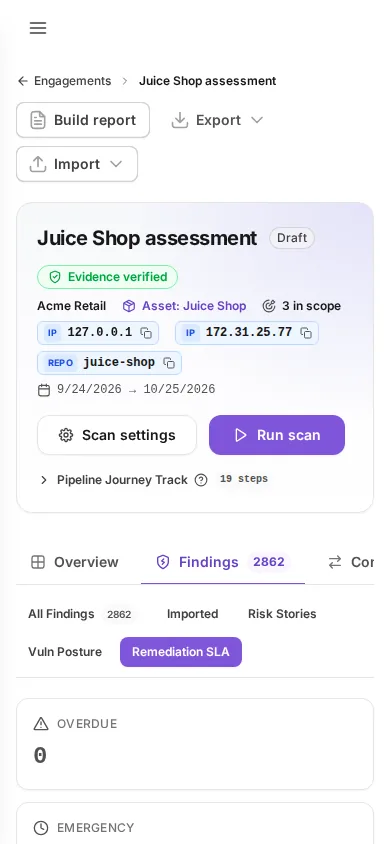
Deadlines per finding: Tier / score, Mitigate by, Remediate by, Workflow, Policy. Transition records a state change with its audit reason, and shows the prior transitions and deadline assessments.
- The panel states the risk-based deadline for each finding and whether it is met, at risk, or breached.
- Open Transition history on a finding to see who moved it, when, and the reason they recorded.
- Open Deadline assessments to see how the deadline was derived, not just what it is.
- Accepting a risk requires a reason and an expiry; both are audited and the acceptance lapses on its own.
- The tab is empty and says so when
SYNAPSE_SLA_ENABLEDis off.
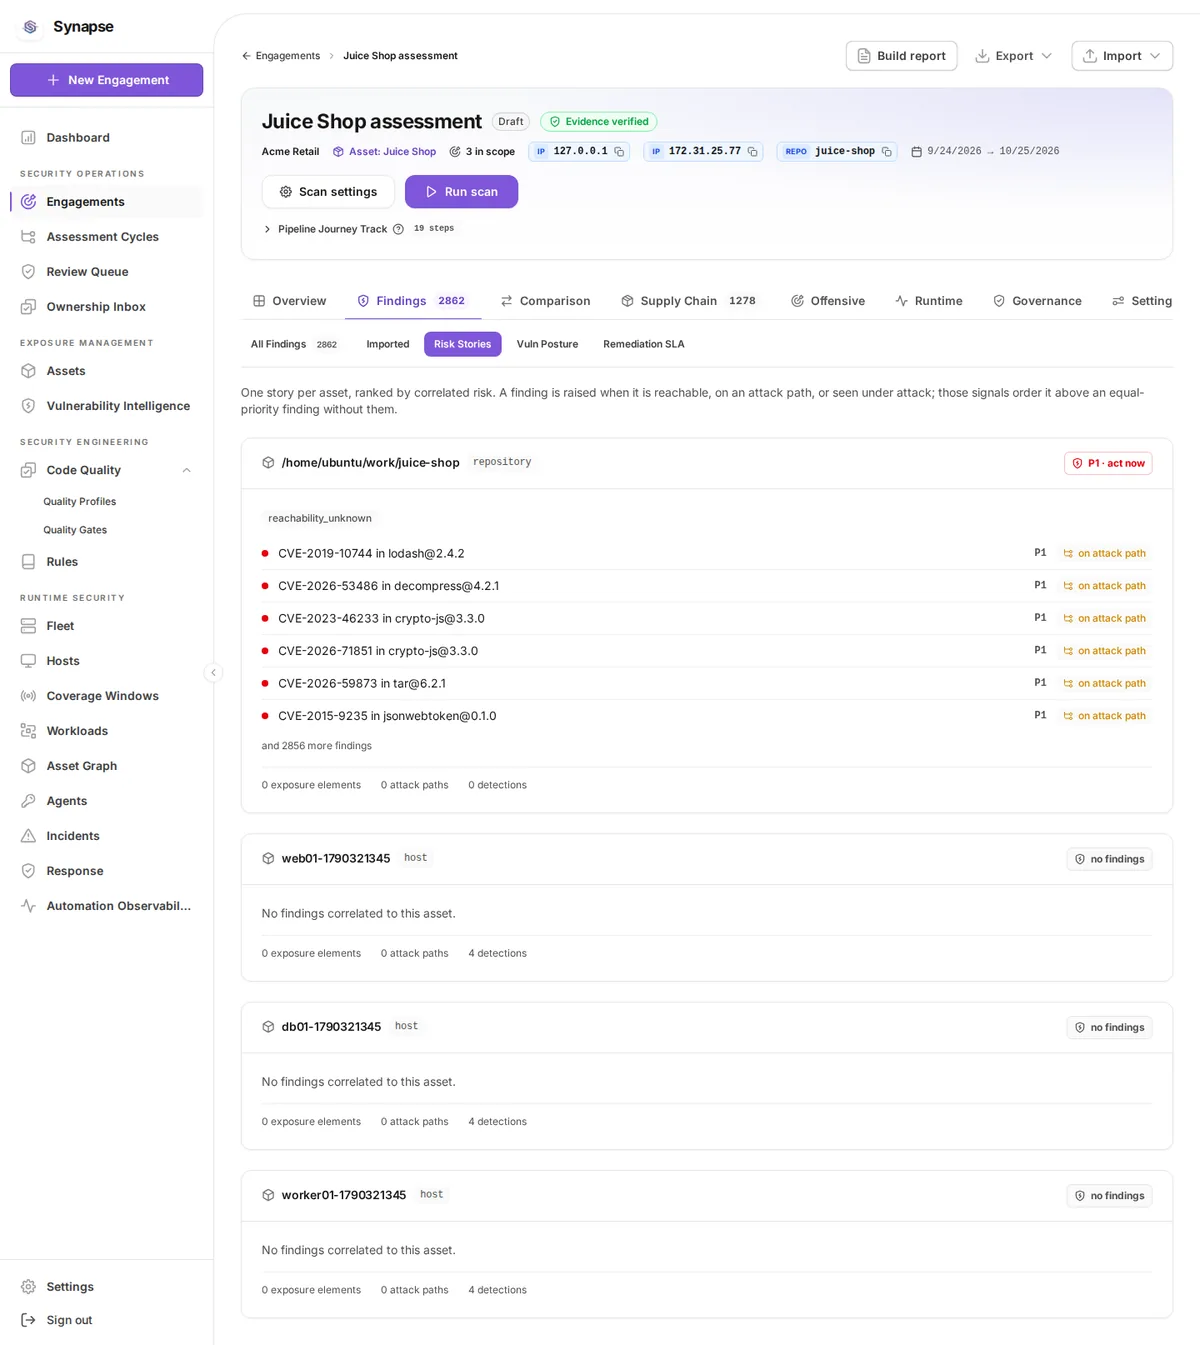
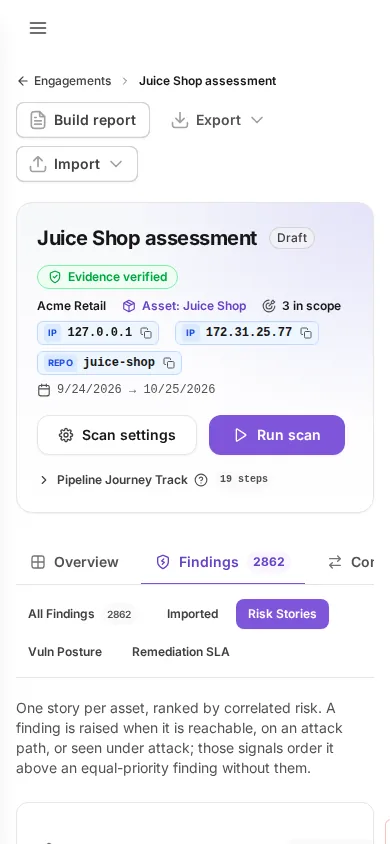
Risk Stories
/engagements/{id}/risk-stories
Per-asset risk narrative assembled from the findings.
- A risk story groups findings, assets and detections that describe one attack narrative rather than one defect.
- Each story names the asset it is about and the evidence that correlated it.
- Stories are produced by correlation over the scan and fleet data, so an engagement with neither shows none.
- Open a story to reach the findings underneath it.
Vuln Posture
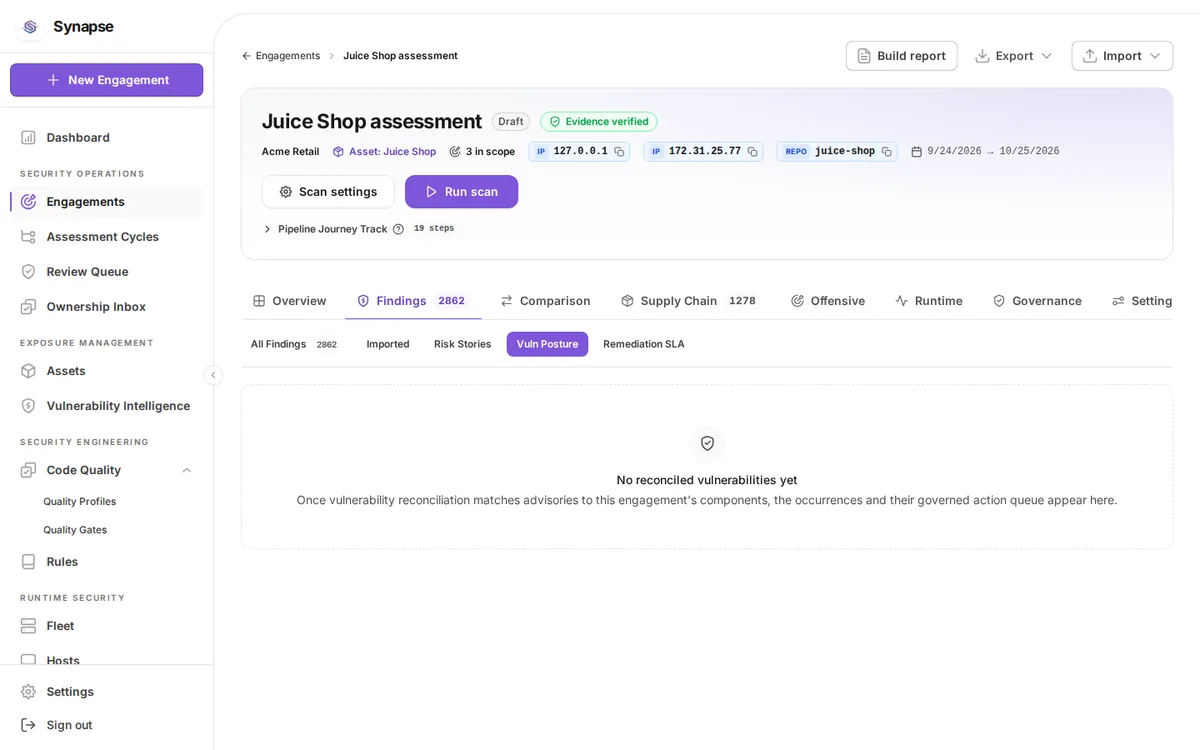
/engagements/{id}/vuln-posture
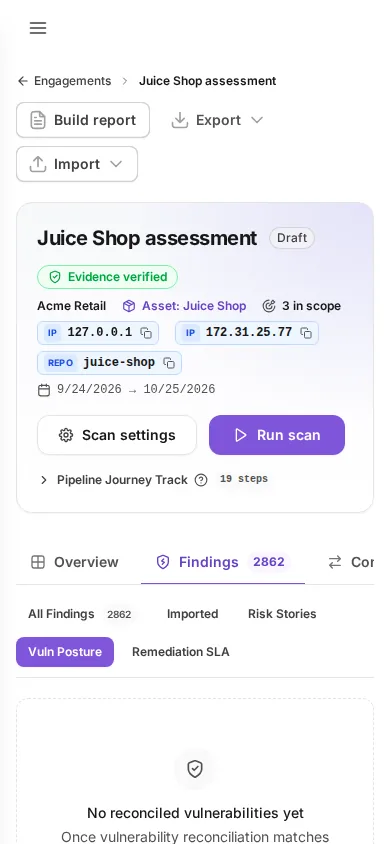
Vulnerability posture for this engagement, with an acknowledge / resolve queue.
- Reconciled occurrences lists every place a vulnerability was observed for this engagement, after reconciliation against the advisory store.
- The Action queue holds the ones still awaiting a decision.
- Press Acknowledge to record that the occurrence is known and accepted for now, or Resolve to close it.
- Both write to the audit log with the actor; neither edits the finding's evidence.
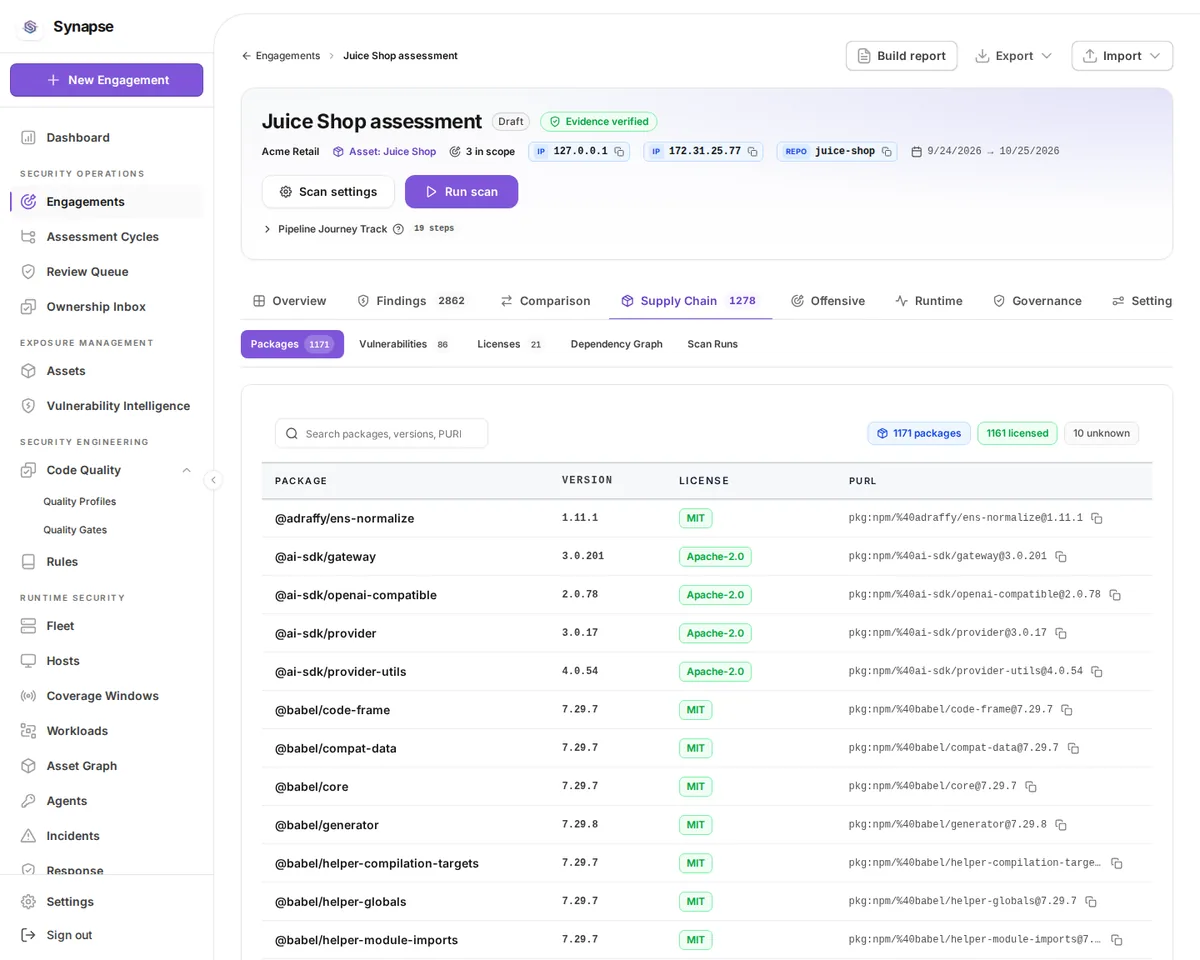
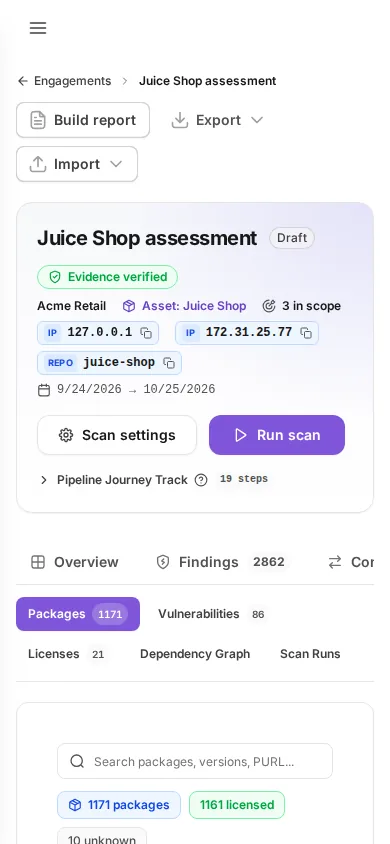
Packages
/engagements/{id}/components
The software bill of materials: every package the scan cataloged.
- Every component the scan resolved, with its version, PURL and licenses.
- Search by name, version, PURL or license.
- An empty list on an application that has dependencies is an unresolved result, not a clean one: a manifest without a lockfile cannot be pinned unless manifest resolution is enabled.
- Components come from Synapse's own per-ecosystem parsers; no third-party scanner is involved by default.
Vulnerabilities
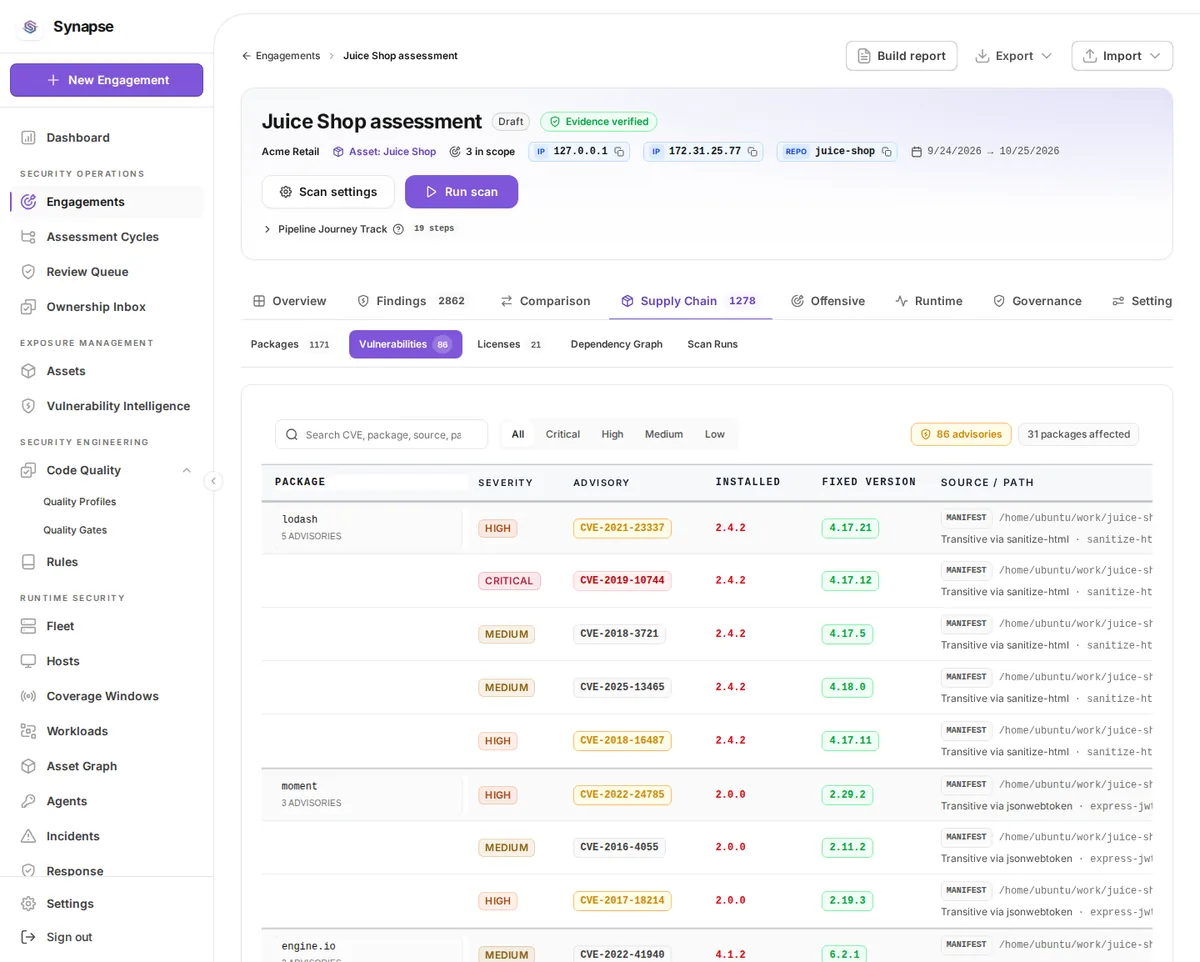
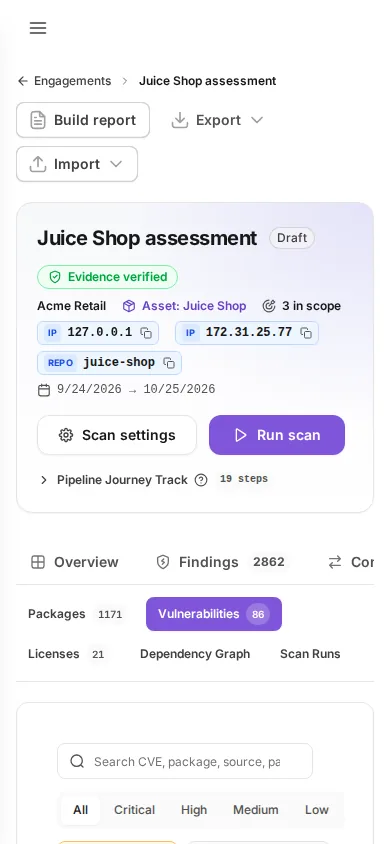
/engagements/{id}/vulns
Advisory matches against the cataloged packages.
- Each row is a vulnerability matched against a resolved component, with severity, CVSS, EPSS and whether it is in CISA KEV.
- Direct says whether the project depends on the affected package itself or reaches it through another one.
- Path shows the route from a direct dependency to the vulnerable package, which is what makes a transitive finding actionable.
- The fix column carries the fixed version and how confident the upgrade is.
- Search matches the identifier, the component and the description.
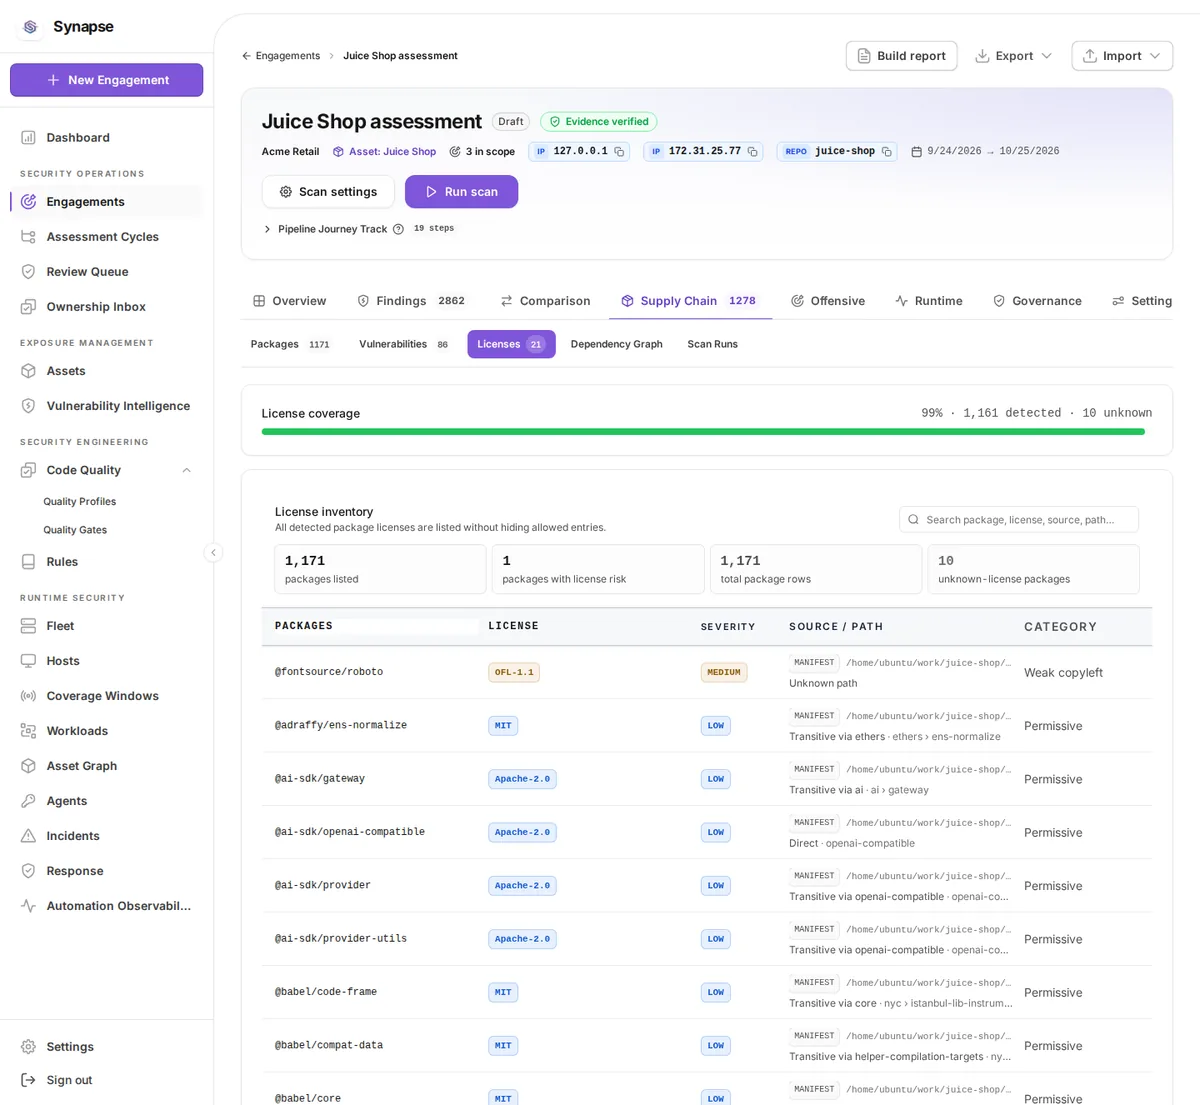
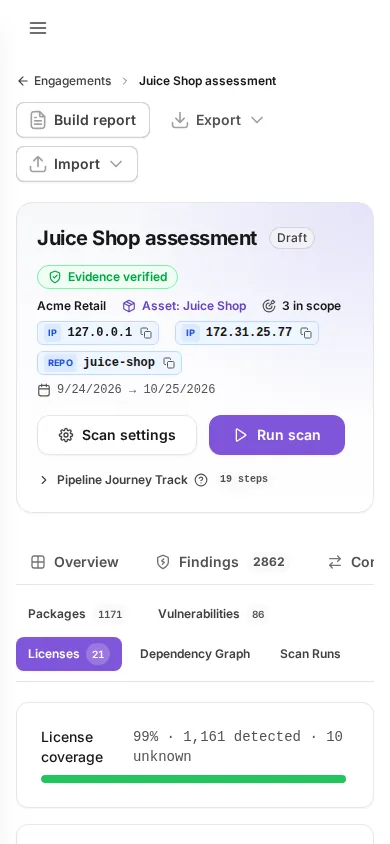
Licenses
/engagements/{id}/licenses
License obligations per component, with the policy verdict.
- Every distinct license found across the resolved components, classified against the policy.
- Search by SPDX id or name.
- A component whose license could not be determined is listed as unknown rather than assumed permissive.
Dependency graph
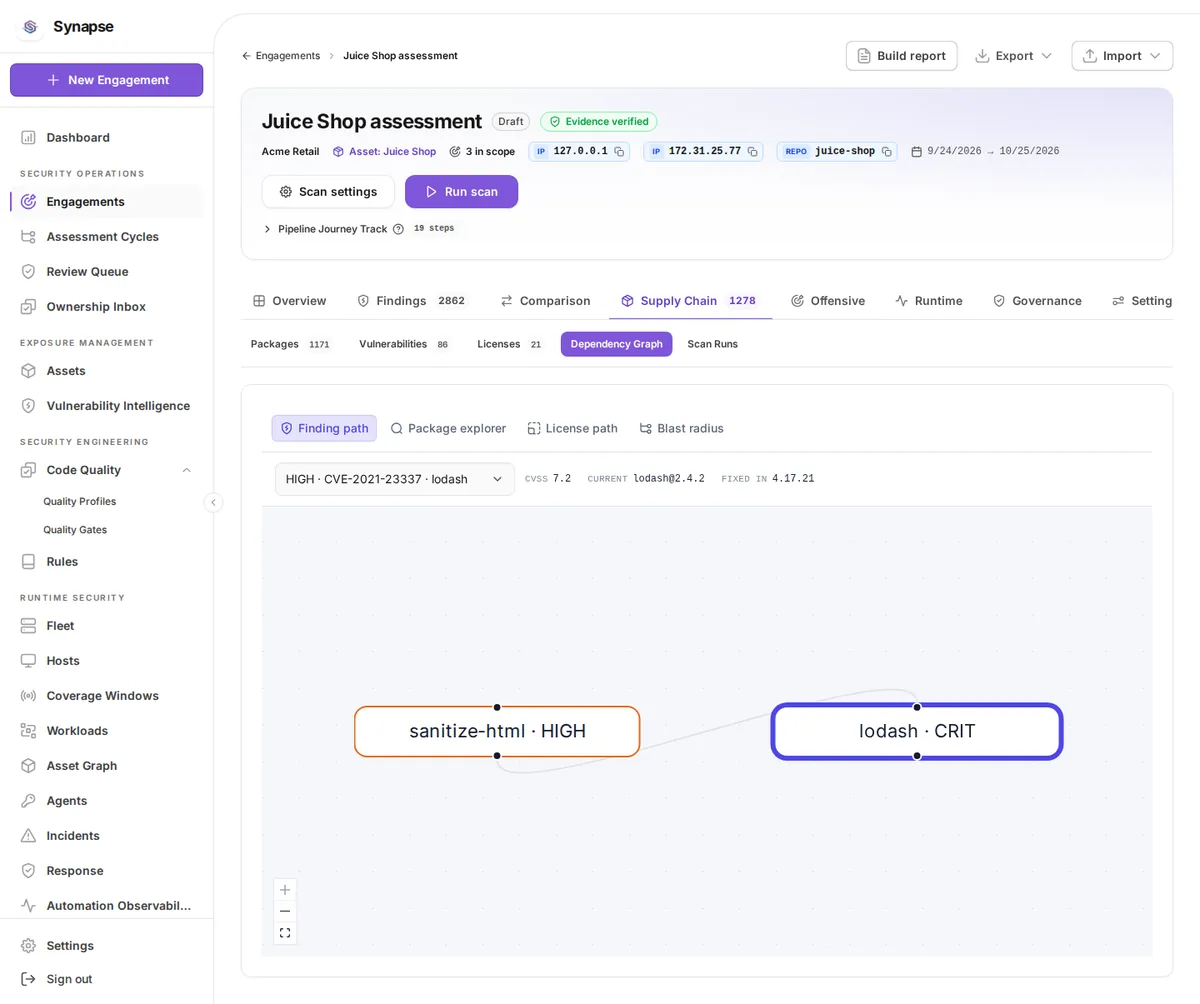
/engagements/{id}/graph
The dependency tree, loaded as its own chunk because only this tab needs it.
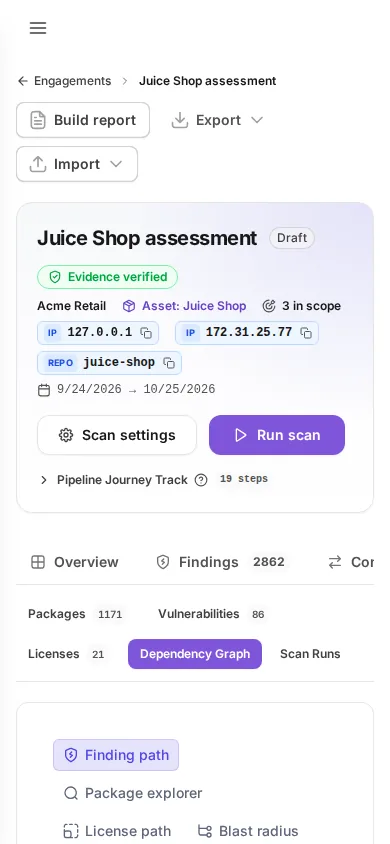
- Choose a mode: finding traces the path to a vulnerable package, explorer walks out from one package, license shows what a license reaches, blast shows what depends on a package.
- In finding mode, step through the vulnerabilities with the selector; the graph redraws for each.
- In explorer mode, pick a focus package and a depth.
- Solid edges were observed in the lockfile; the graph is empty when the scan resolved no dependency edges.
- Pan and zoom with the controls; the minimap shows where you are in a large graph.
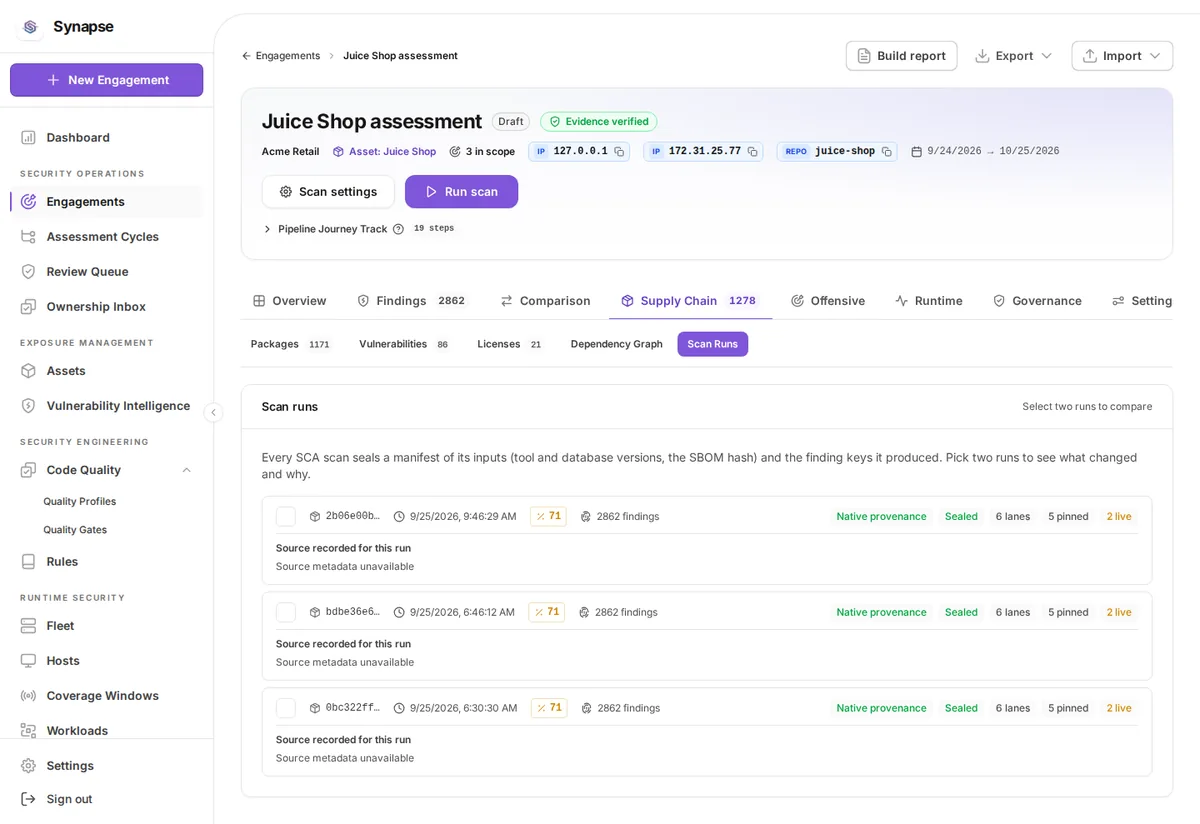
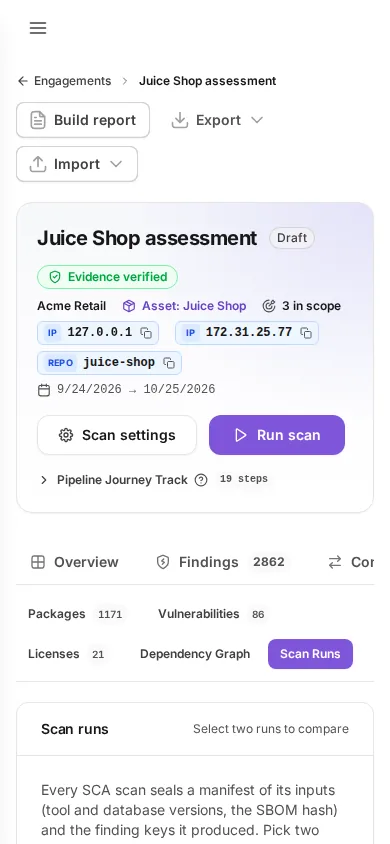
Scan runs
/engagements/{id}/scanruns
Every run with its provenance lanes, and the drift between runs.
- Every scan this engagement has run, newest first, with its status, duration and the tool versions it pinned.
- Select two runs and press Compare A and B to see what changed between them.
- The diff separates findings that appeared, findings that went away, and changes caused by the advisory database moving rather than the code.
- Each run links to the evidence it sealed.
Credentials
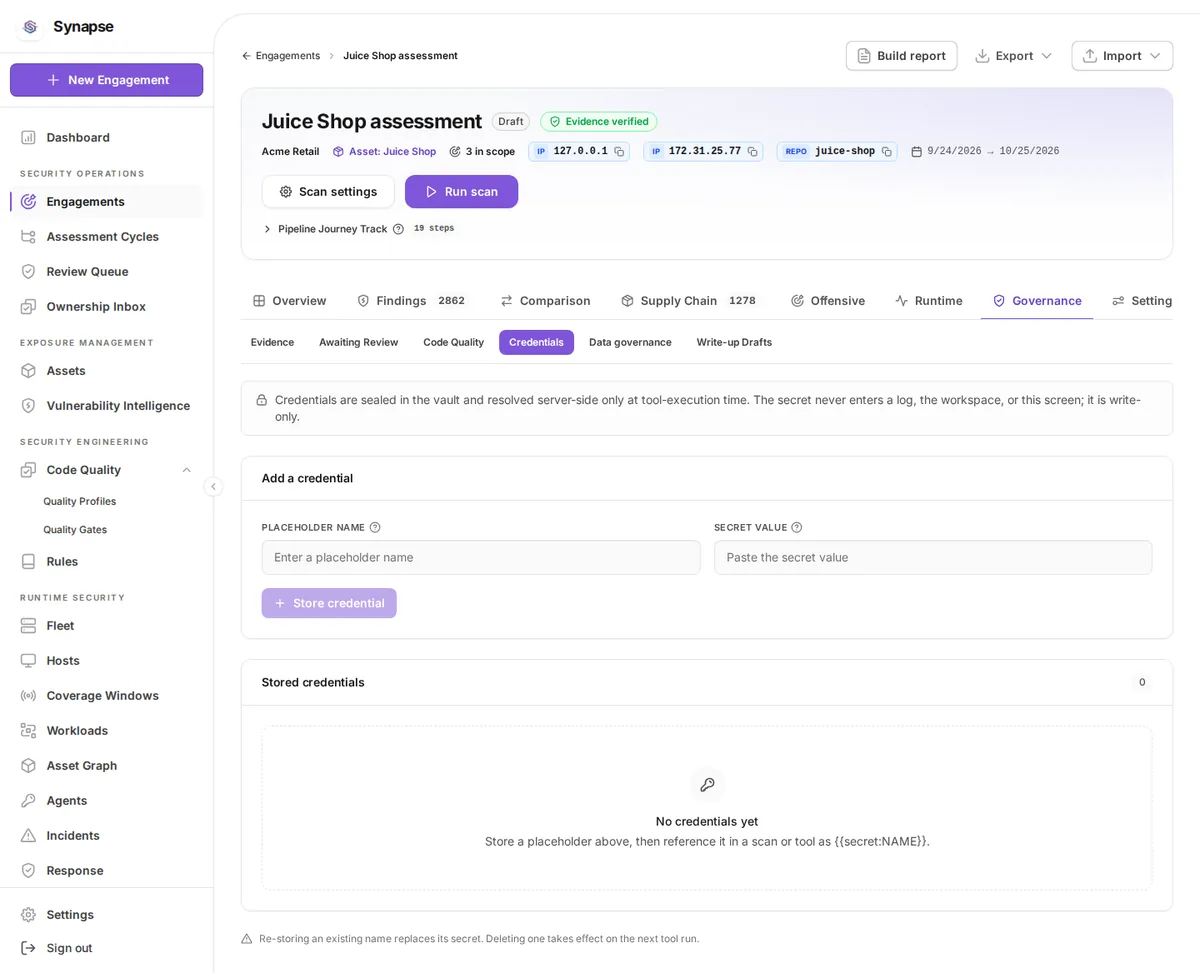
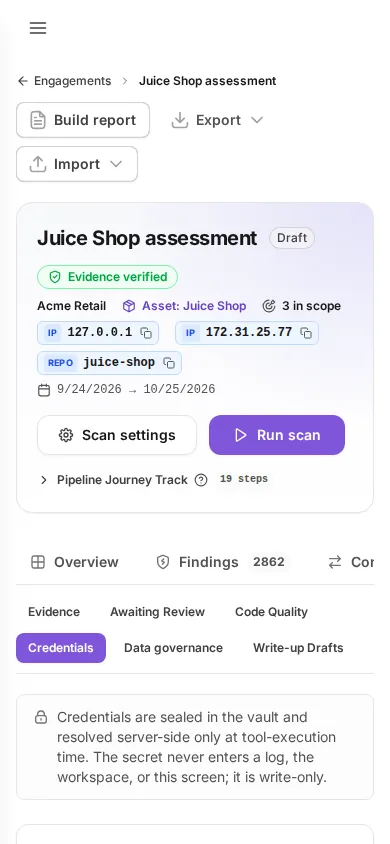
/engagements/{id}/credentials
Credentials in scope for this engagement, vault-backed.
- Stores the credentials a scan or probe needs, by placeholder name, so no secret ever reaches argv or a log.
- Press Add a credential, give it a placeholder name and the secret value, and save.
- Reference it elsewhere as
{{secret:NAME}}; the server substitutes it at execution time. - A stored value is never shown again, and Delete asks for confirmation.
- Secrets are scrubbed from tool output, from sealed evidence, and from a tool's error before any of them is stored.
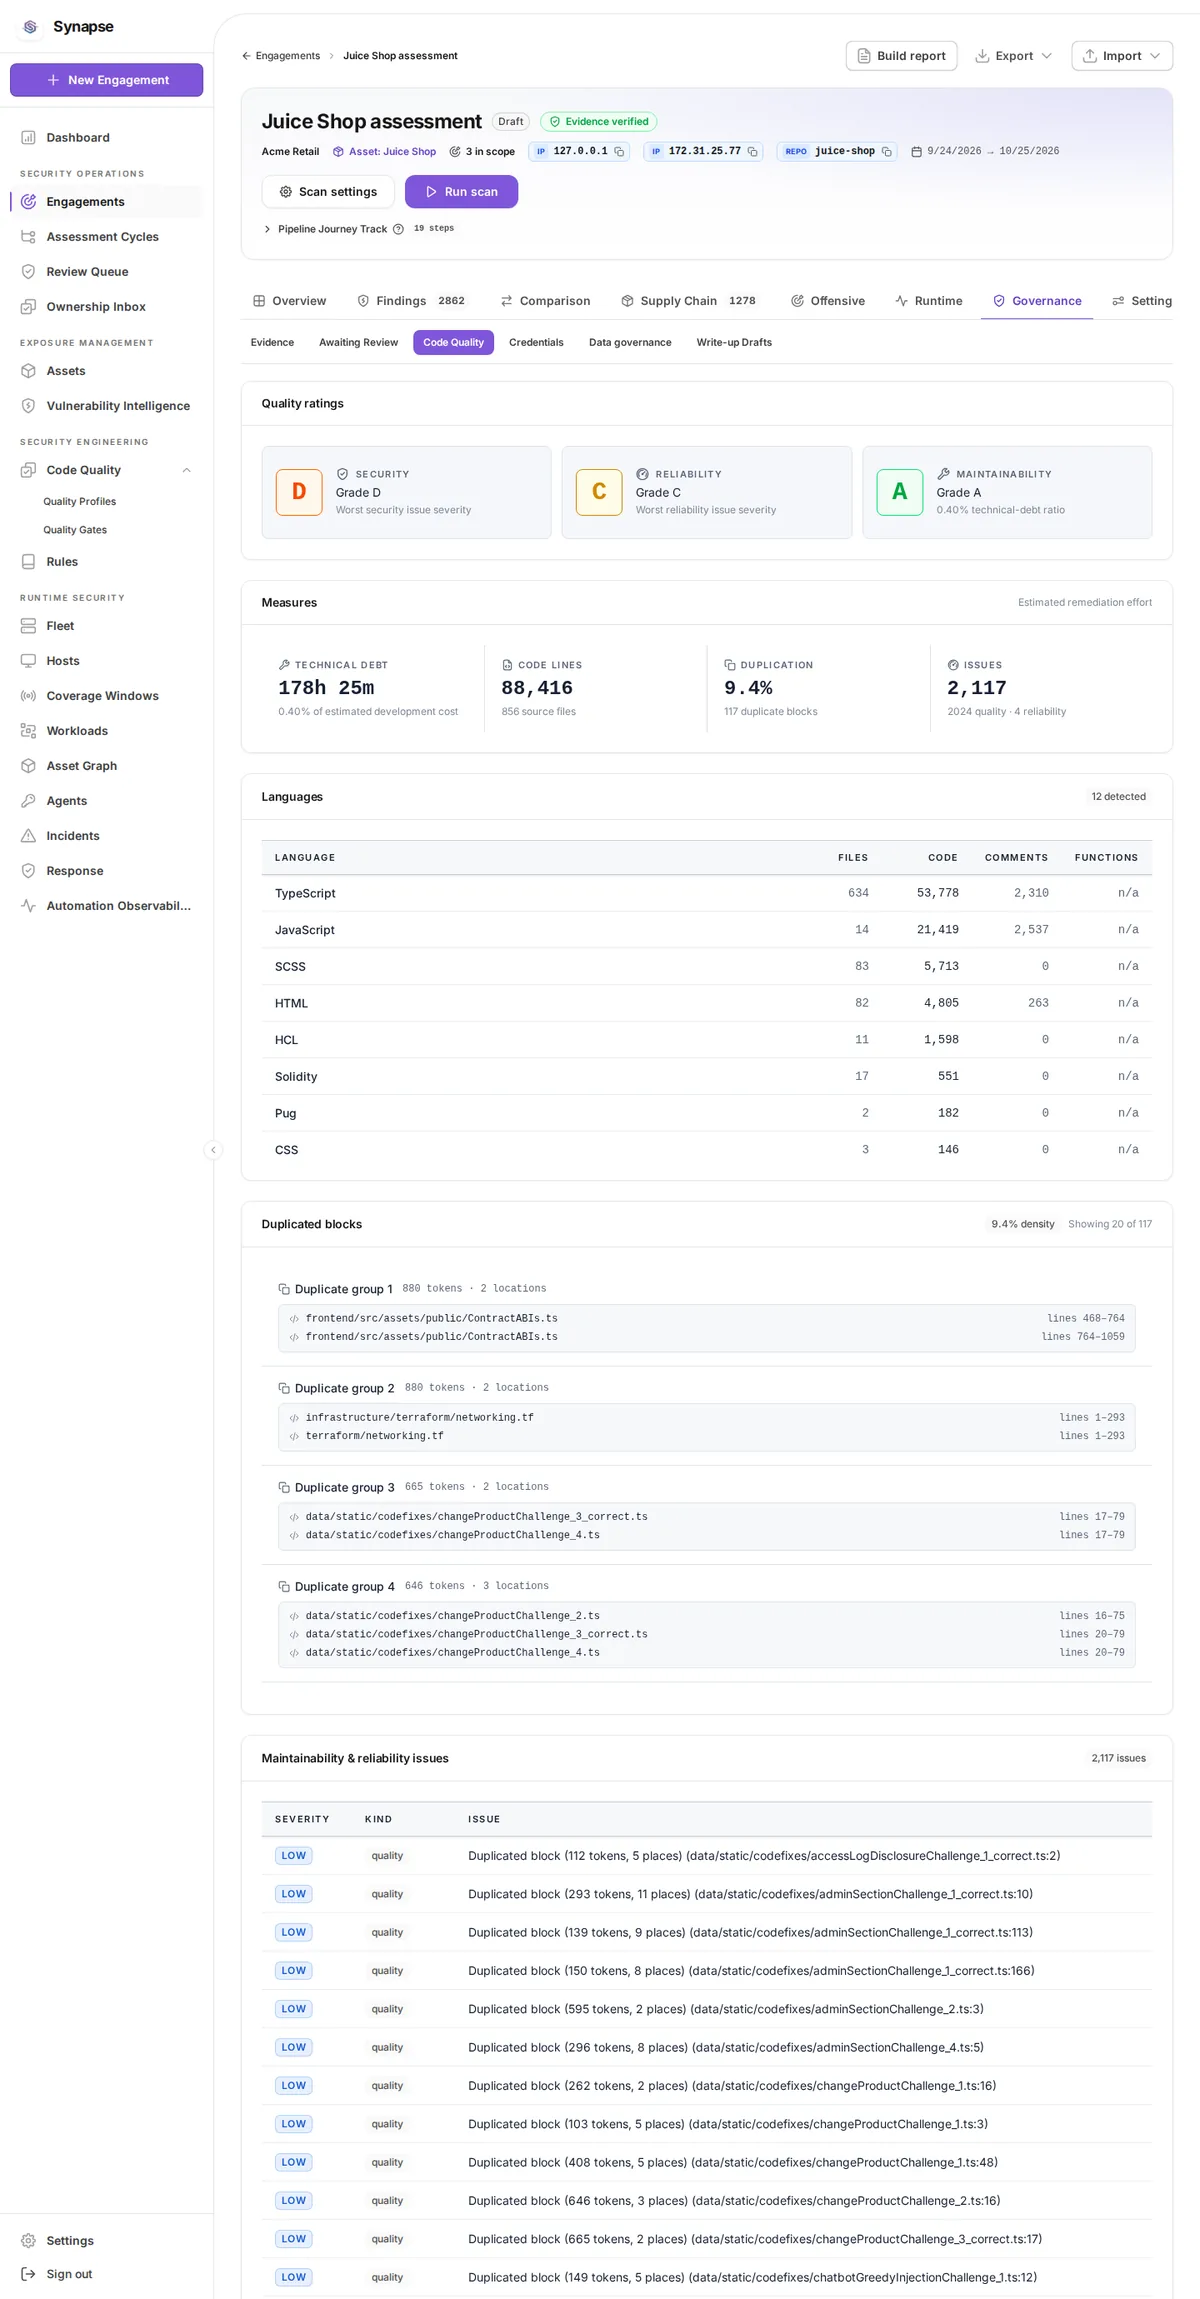
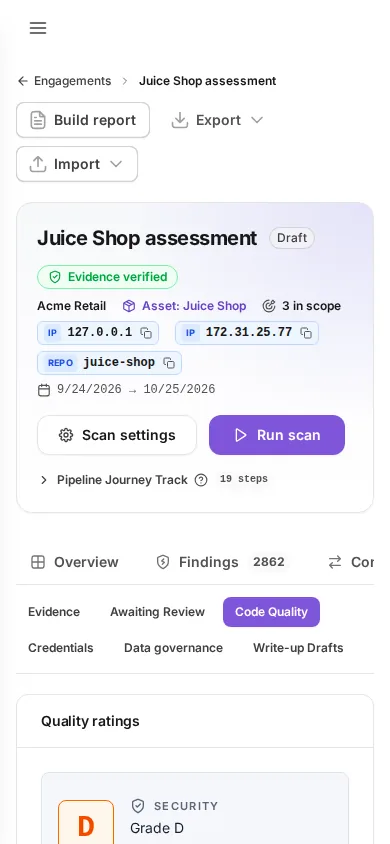
Code quality
/engagements/{id}/quality
The code-quality view scoped to this engagement.
- The latest code-quality analysis for the project bound to this engagement: the quality gate verdict and the issue counts by kind and severity.
- The gate says which condition failed, with the threshold and the actual value.
- Follow through to the Code Quality project for the file-level detail.
- The tab says the capability is unavailable rather than showing an empty result when code quality is not configured.
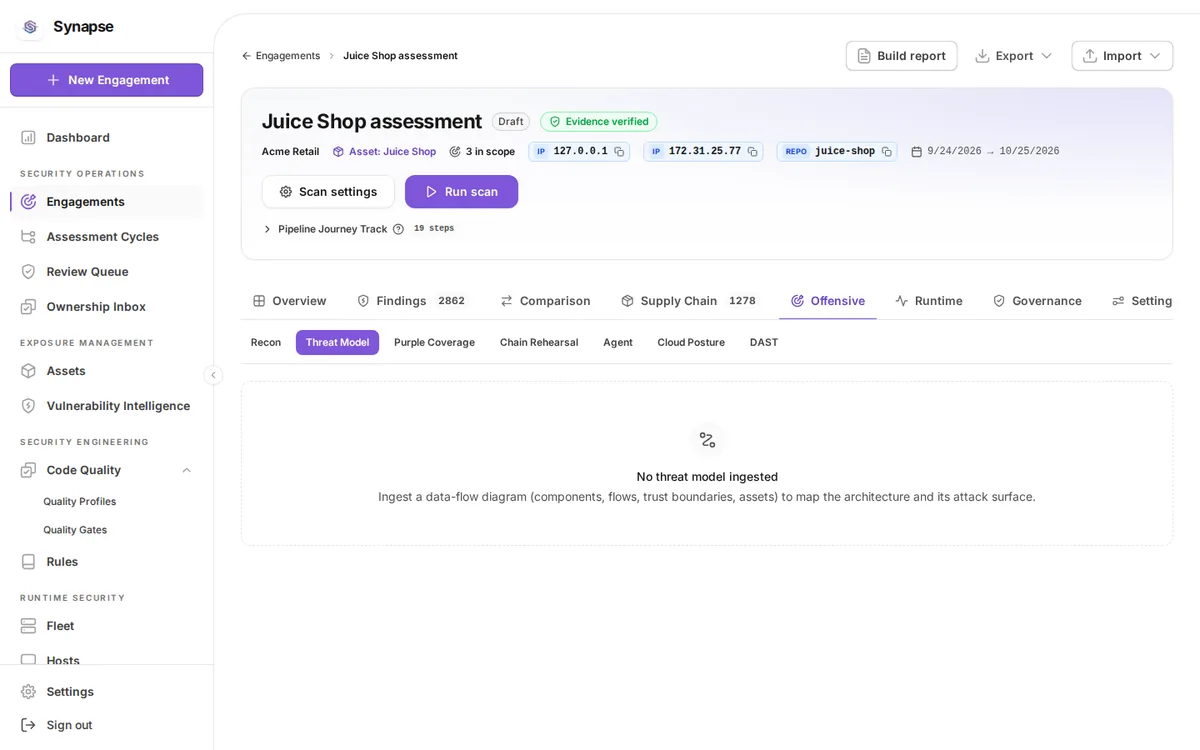
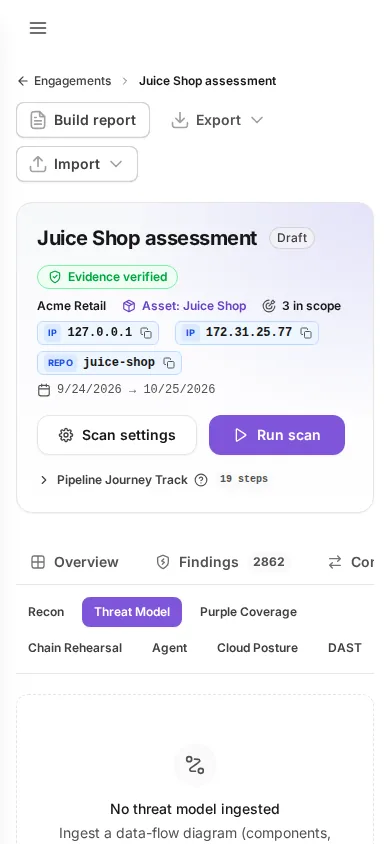
Threat model
/engagements/{id}/threats
The threat model for the target.
- Holds an ingested threat model: trust boundaries, components, data flows and the assets they touch.
- Read the counts first, then the boundary crossings, which are where a data flow leaves a trust boundary.
- Nothing is inferred here; the model is what was ingested.
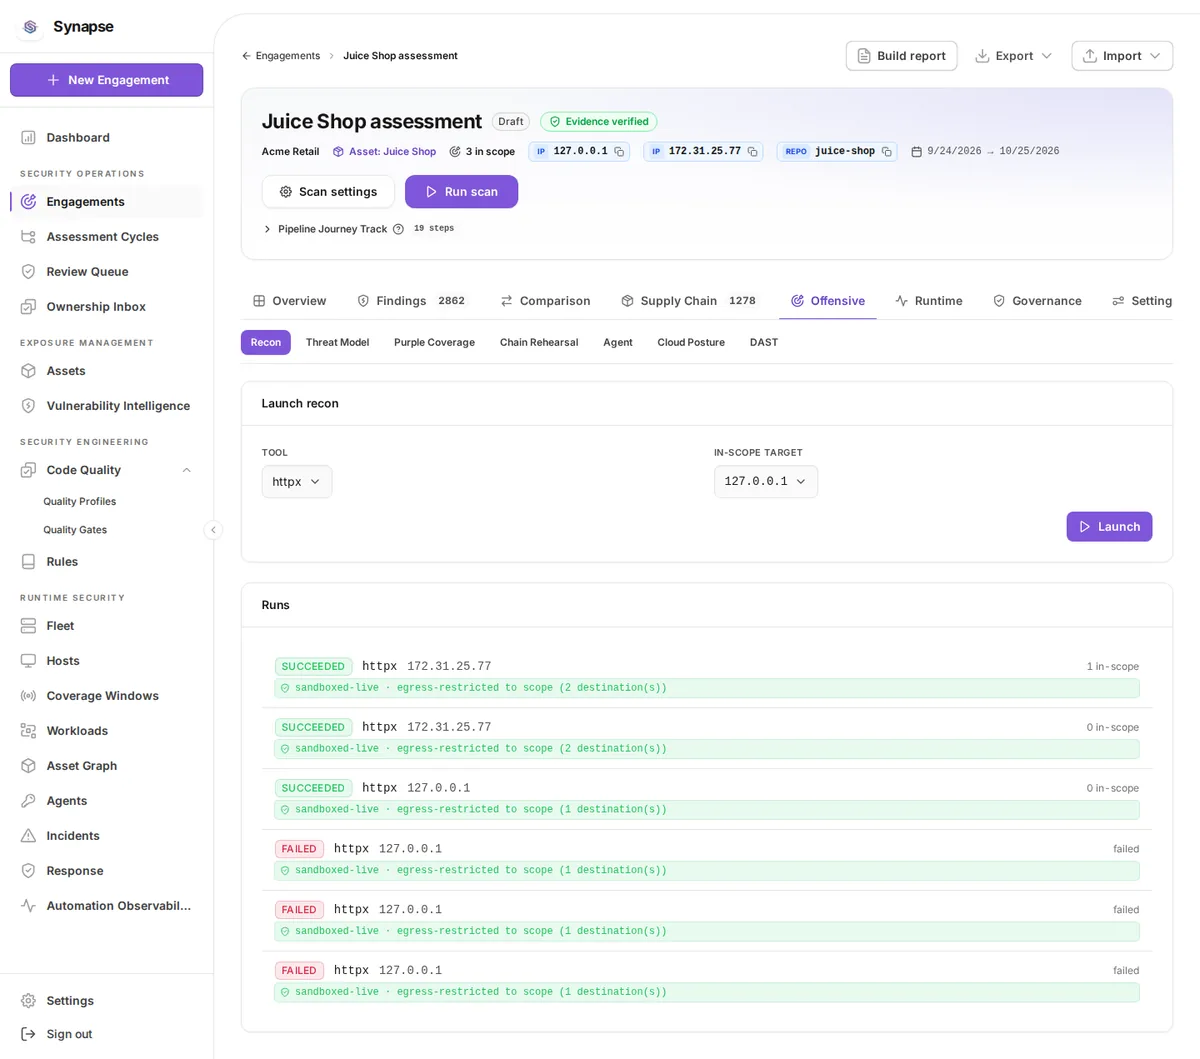
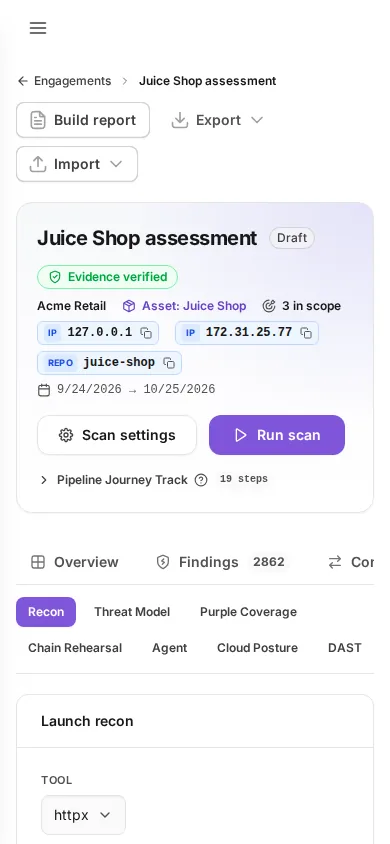
Recon
/engagements/{id}/recon
Recon runs. A run is proposed, gated on scope and authorization, then approved by a human.
- Live recon is off until it is enabled in Settings, and the tab says so with a link there.
- Choose a Tool and an in-scope target; only targets inside the engagement's scope are offered, and the server checks scope and the authorization window again before anything runs.
- Press Launch. The run appears in Runs with its containment posture, which names the sandbox and how egress was restricted.
- Open Live log to watch the tool's output as it arrives.
- Every run seals its output into the evidence chain, including a failed one, and records the connect attempts the kernel observed.
Purple coverage
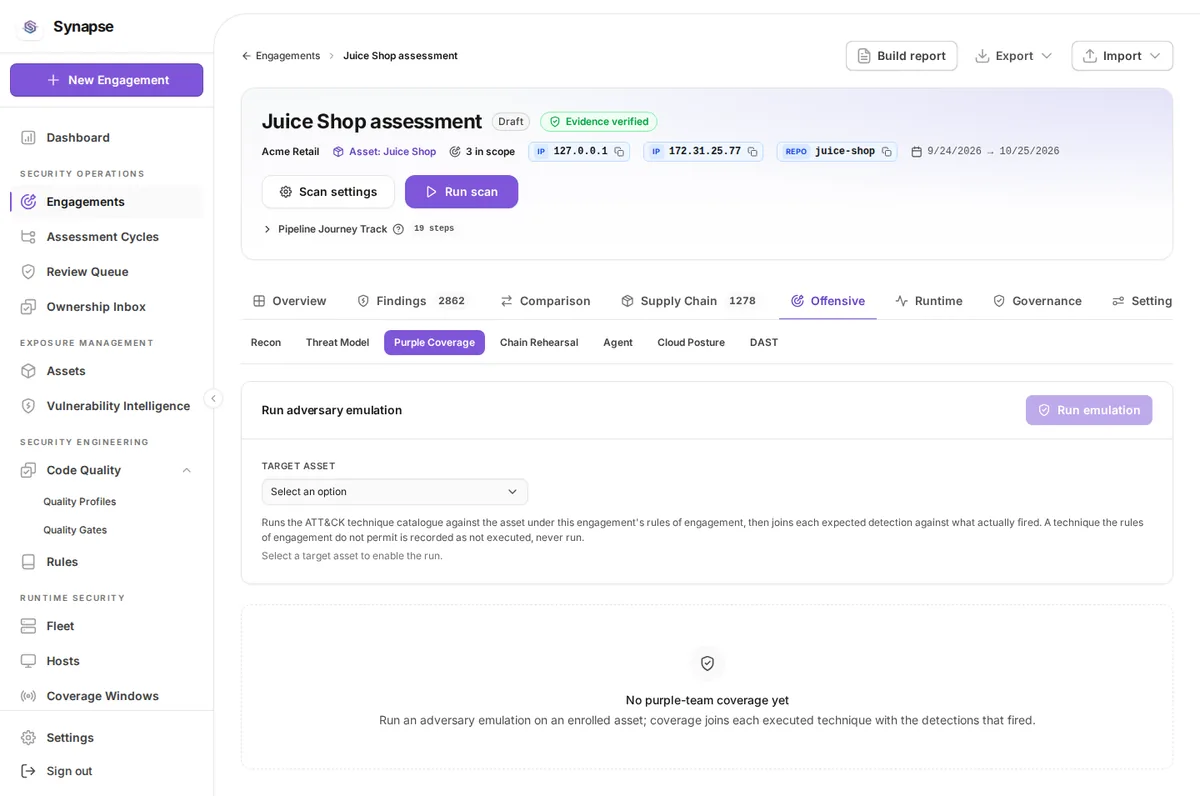
/engagements/{id}/purple
Which detections cover which attack techniques.
- Detection coverage compares the techniques an emulation exercised against the detections that fired.
- Detection gaps to close lists techniques that ran and were not detected, which is the list worth acting on.
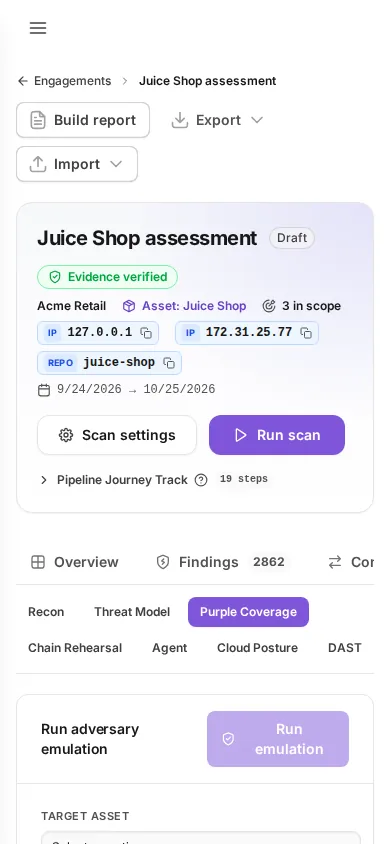
- Pick a Target asset and press Run emulation to run benign technique variants.
- Each technique declares the detection it expects, so a gap is a statement about a control, not about the tool.
- Coverage by emulation run keeps the history so improvement is visible.
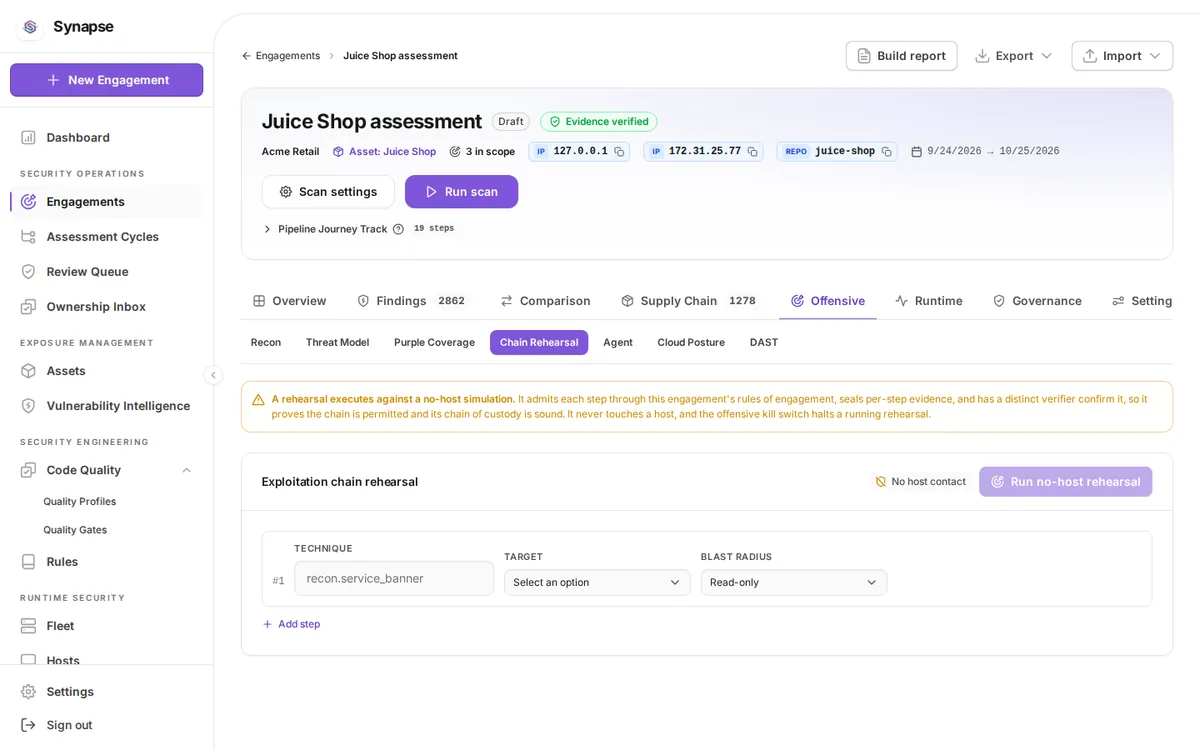
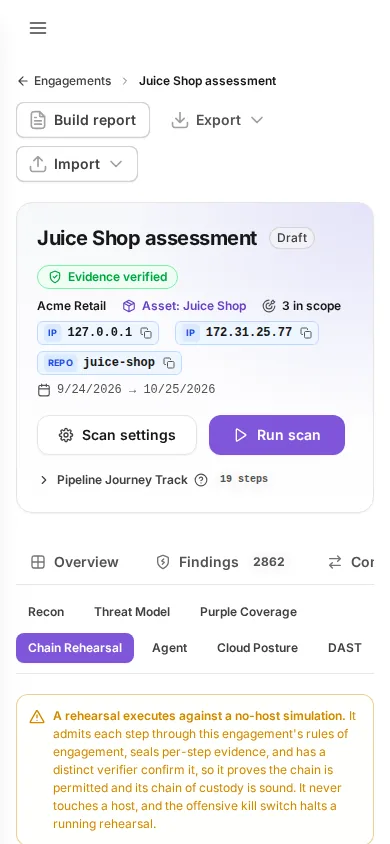
Chain rehearsal
/engagements/{id}/rehearsal
Attack-chain rehearsal against the modelled path.
- A rehearsal proves an exploitation chain is permitted and that its chain of custody is sound. It executes against a no-host simulation and never touches a host.
- Add each step with its technique, target, blast radius (read-only or state-changing) and, for a state-changing step, its cleanup.
- Press Run no-host rehearsal. Each step is admitted against the engagement's rules of engagement before it runs.
- Every step seals its own evidence and is confirmed by a verifier distinct from the proposer.
- The offensive kill switch halts a running rehearsal.
AI agent
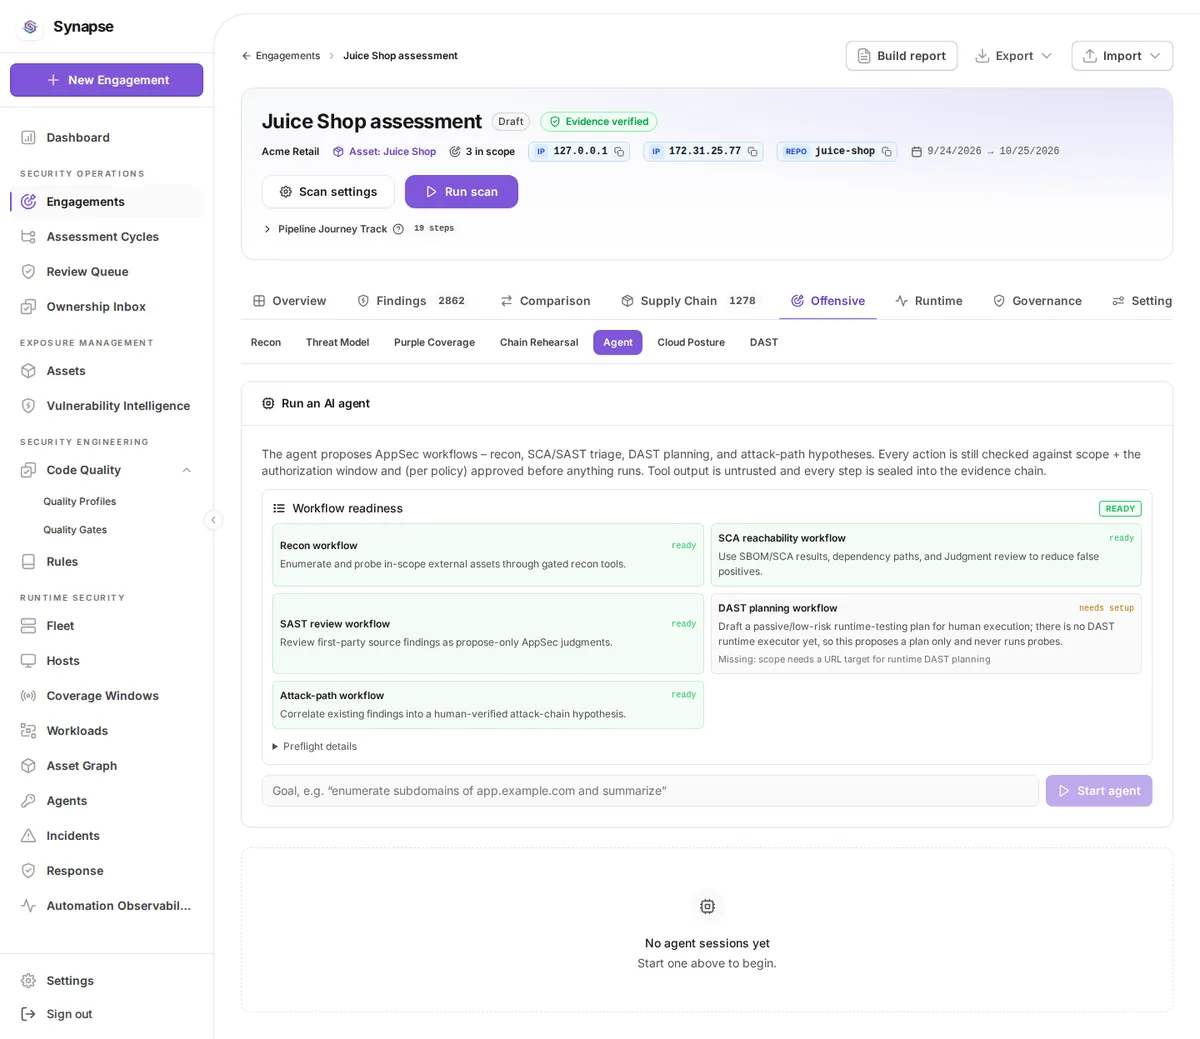
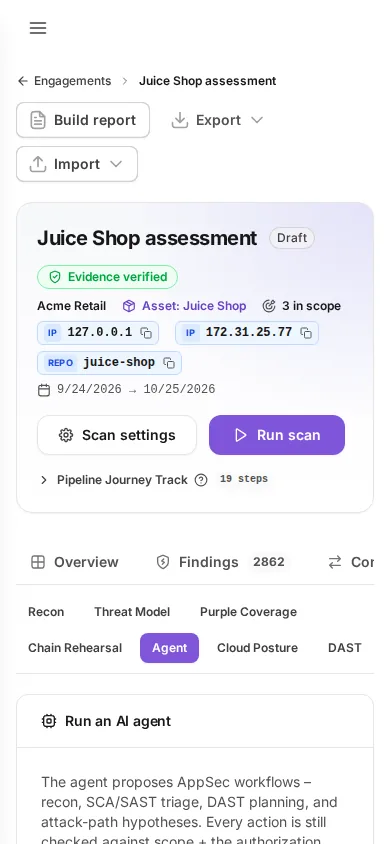
/engagements/{id}/agent
The AI session transcript: the goal, each tool call, and the token cost.
- Write the Agent goal and press Start agent.
- The agent proposes; it never confirms its own claim, and no model sits in the report path.
- Watch the Transcript for each tool call, its result, and the tokens spent.
- With the approval mode set to manual, an action that needs approval waits for a decision rather than proceeding.
- Past sessions stay in Sessions with their decisions and plans.
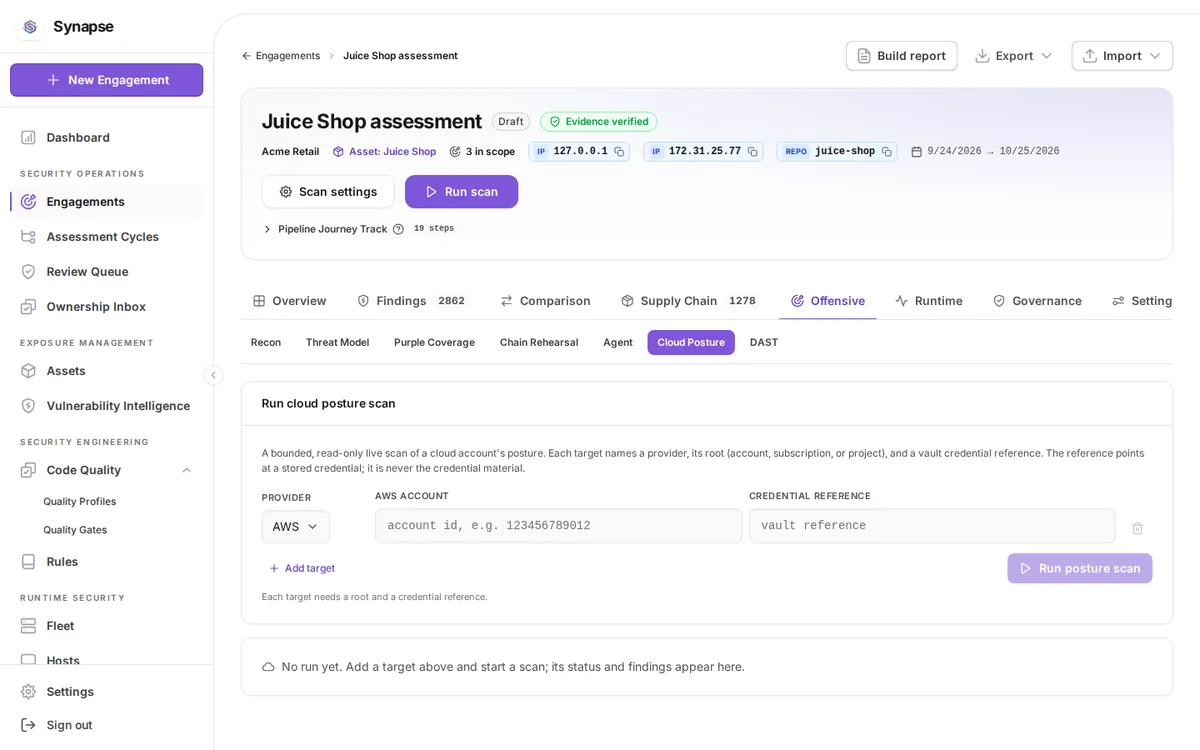
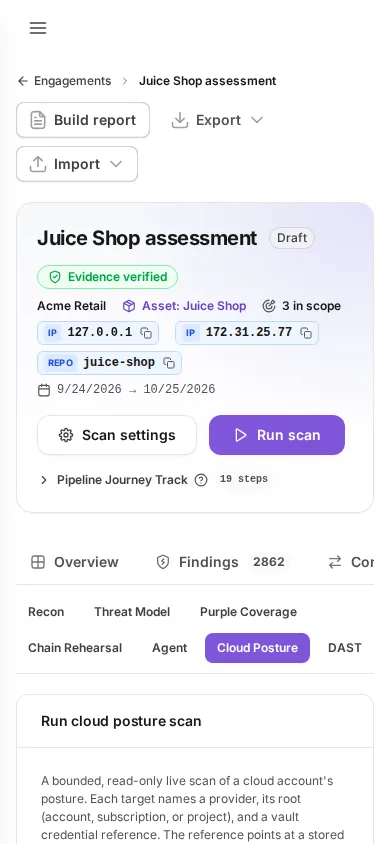
Cloud posture
/engagements/{id}/cspm
Cloud posture findings; an unknown-state resource stays NotAssessed.
- Choose the provider (AWS, Azure or GCP) and press Run posture scan.
- Latest run reports the assets read, the findings raised, and the coverage issues, which are the places the scan could not see.
- Coverage issues matter as much as findings: an unreadable account is not a compliant one.
- Each run links to the evidence it sealed.
- The tab stays off until
SYNAPSE_CSPM_ENABLEDis set.
DAST
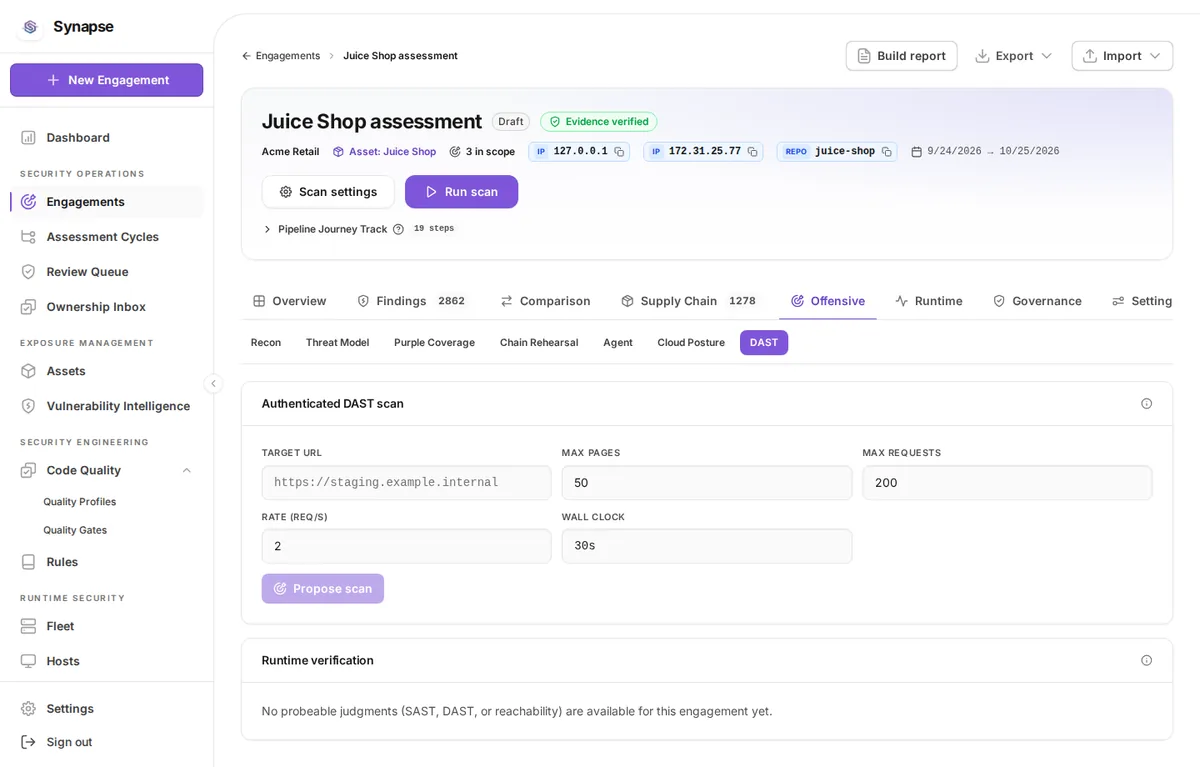
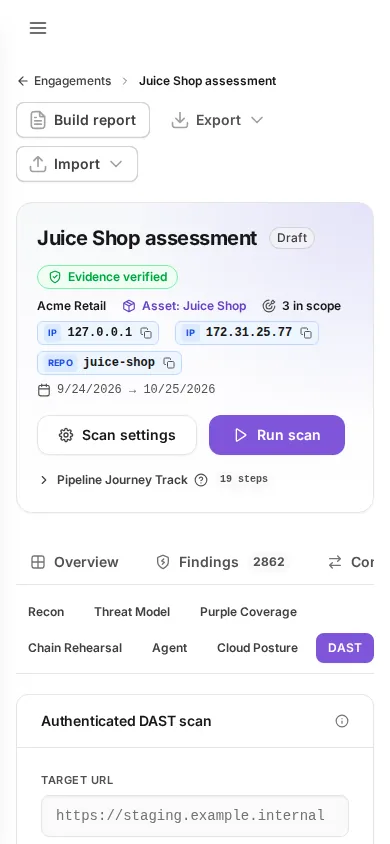
/engagements/{id}/dast
Dynamic testing. A scan or probe is proposed and a distinct reviewer approves it.
- Runtime verification turns a finding into a probe: press Propose probe, fill in the URL, method, expected status and optional expected body.
- A proposal is a claim, not an action. Press Approve or Deny, with a reason; only an approved probe can run.
- Press Run probe. It executes under a kernel-enforced egress allowlist, so it can only reach what the scope permits.
- Authenticated DAST scan follows the same propose, approve, run shape for a full scan.
- The result records what was observed, which is what confirms or refutes the finding.
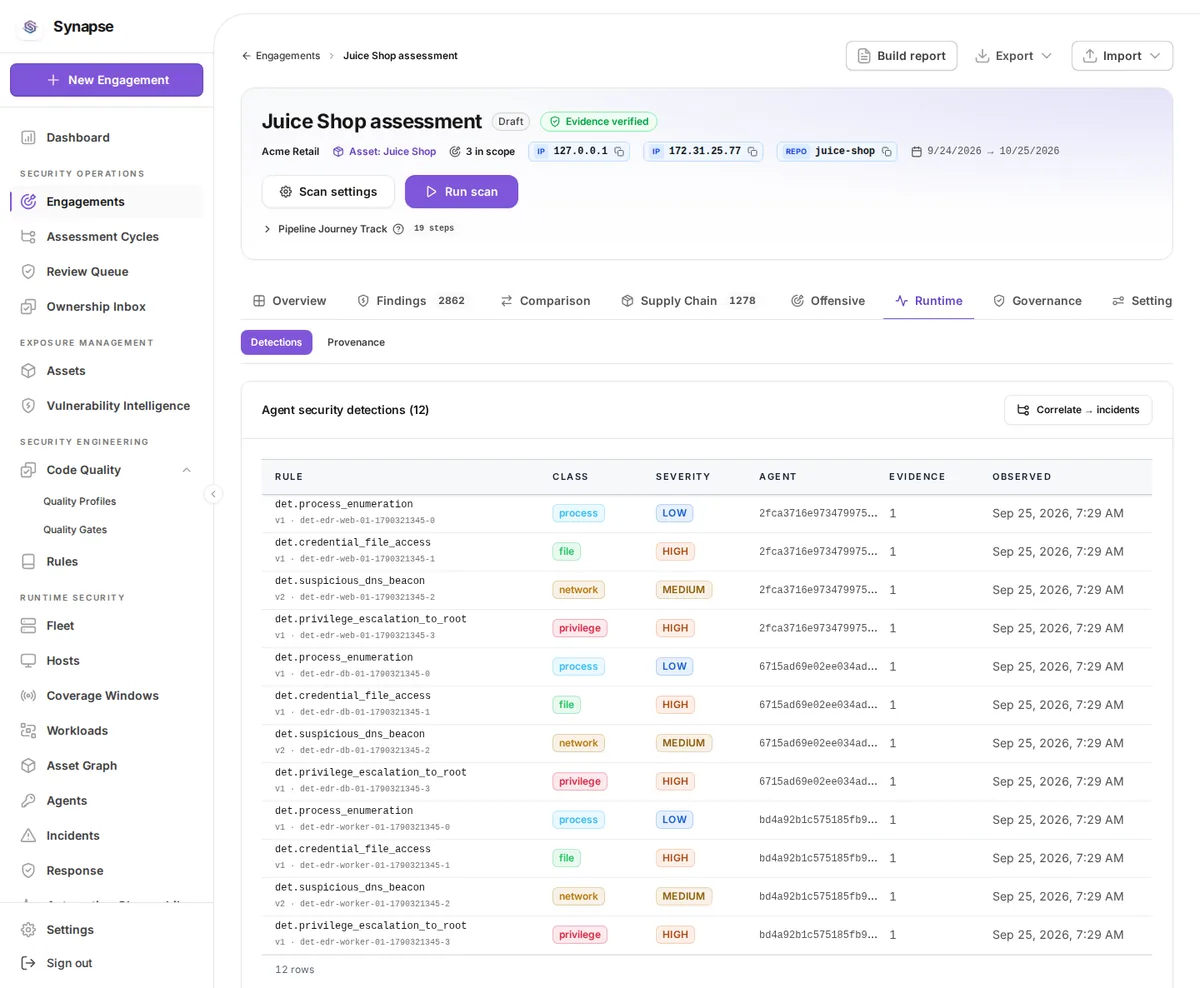
Detections
/engagements/{id}/detections
Runtime detections correlated to this engagement.
- Detections shipped by the fleet agents for this engagement, sealed once into the evidence chain.
- Press correlate to fold the newest detections into incidents.
- A truncated evidence window says so rather than silently showing part of the picture.
- Follow a detection to its provenance to see the chain behind it.
Detection provenance
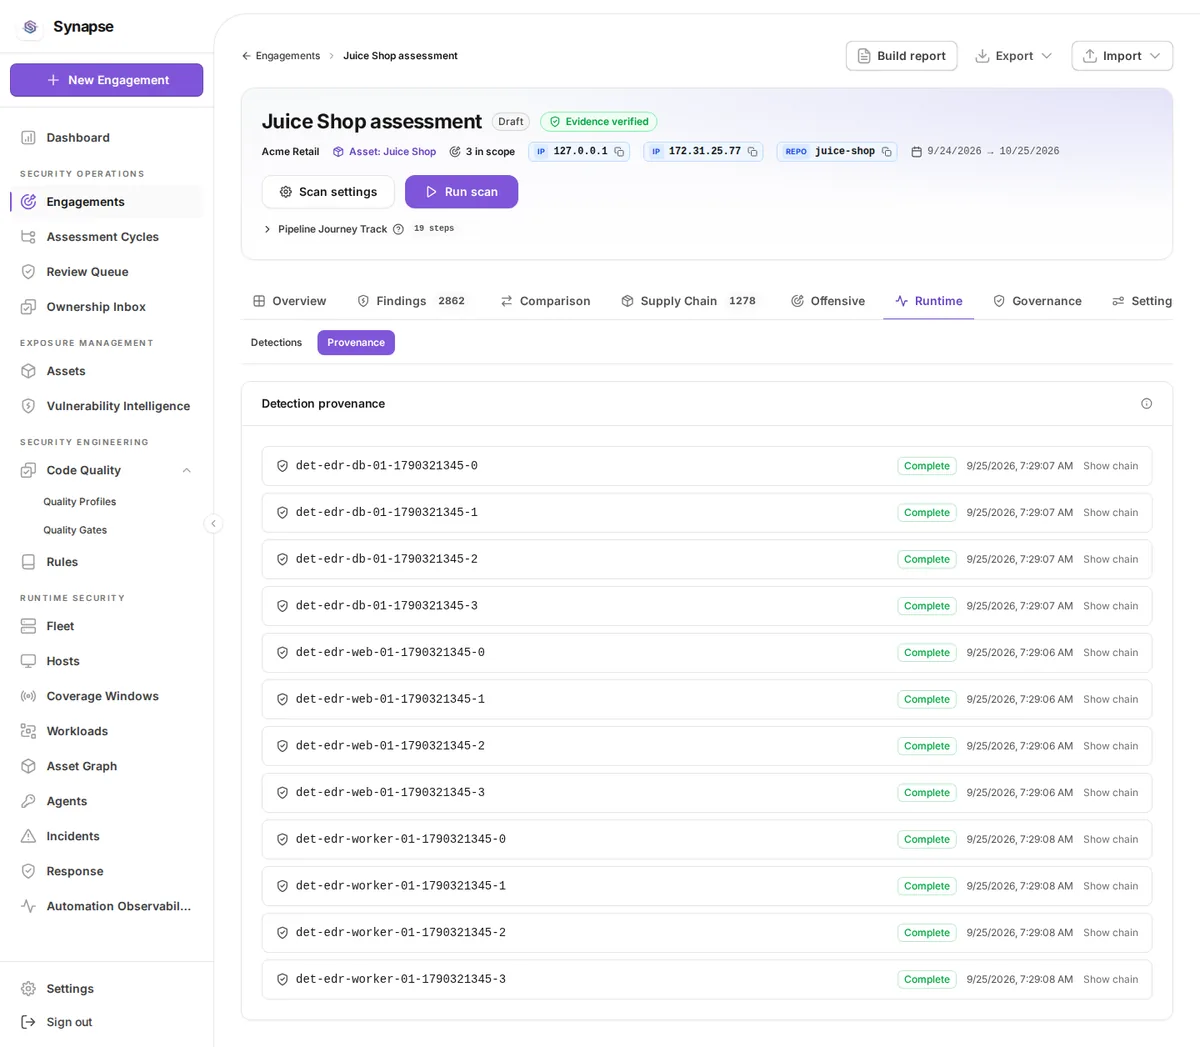
/engagements/{id}/detection-provenance
Where each detection came from and what it was derived from.
- The durable chain behind each detection: what produced it, which key signed it, and whether the chain still verifies.
- A broken chain is stated plainly; it blocks the report rather than degrading it quietly.
- An expired provenance record is distinguished from a broken one.
- Use this tab when you need to defend a detection, not just read it.
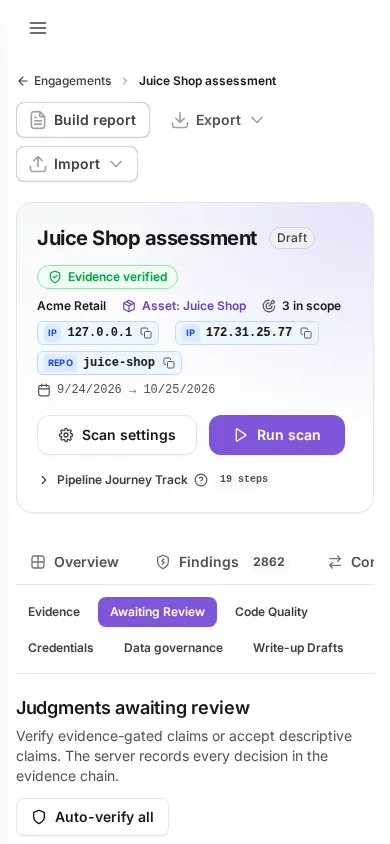
Judgment review
/engagements/{id}/reviews
The propose / verify / confirm record, with the hash-chained evidence ledger.
- Every analysis or AI claim arrives as a proposal that a distinct verifier must confirm.
- Open a judgment to read the evidence score and the rationale recorded with it.
- Confirm or refute it; a proposer can never confirm its own claim.
- Auto-verify all runs the verifier over the queue where the policy allows it.
- An empty queue means nothing is awaiting a human decision, not that nothing was proposed.

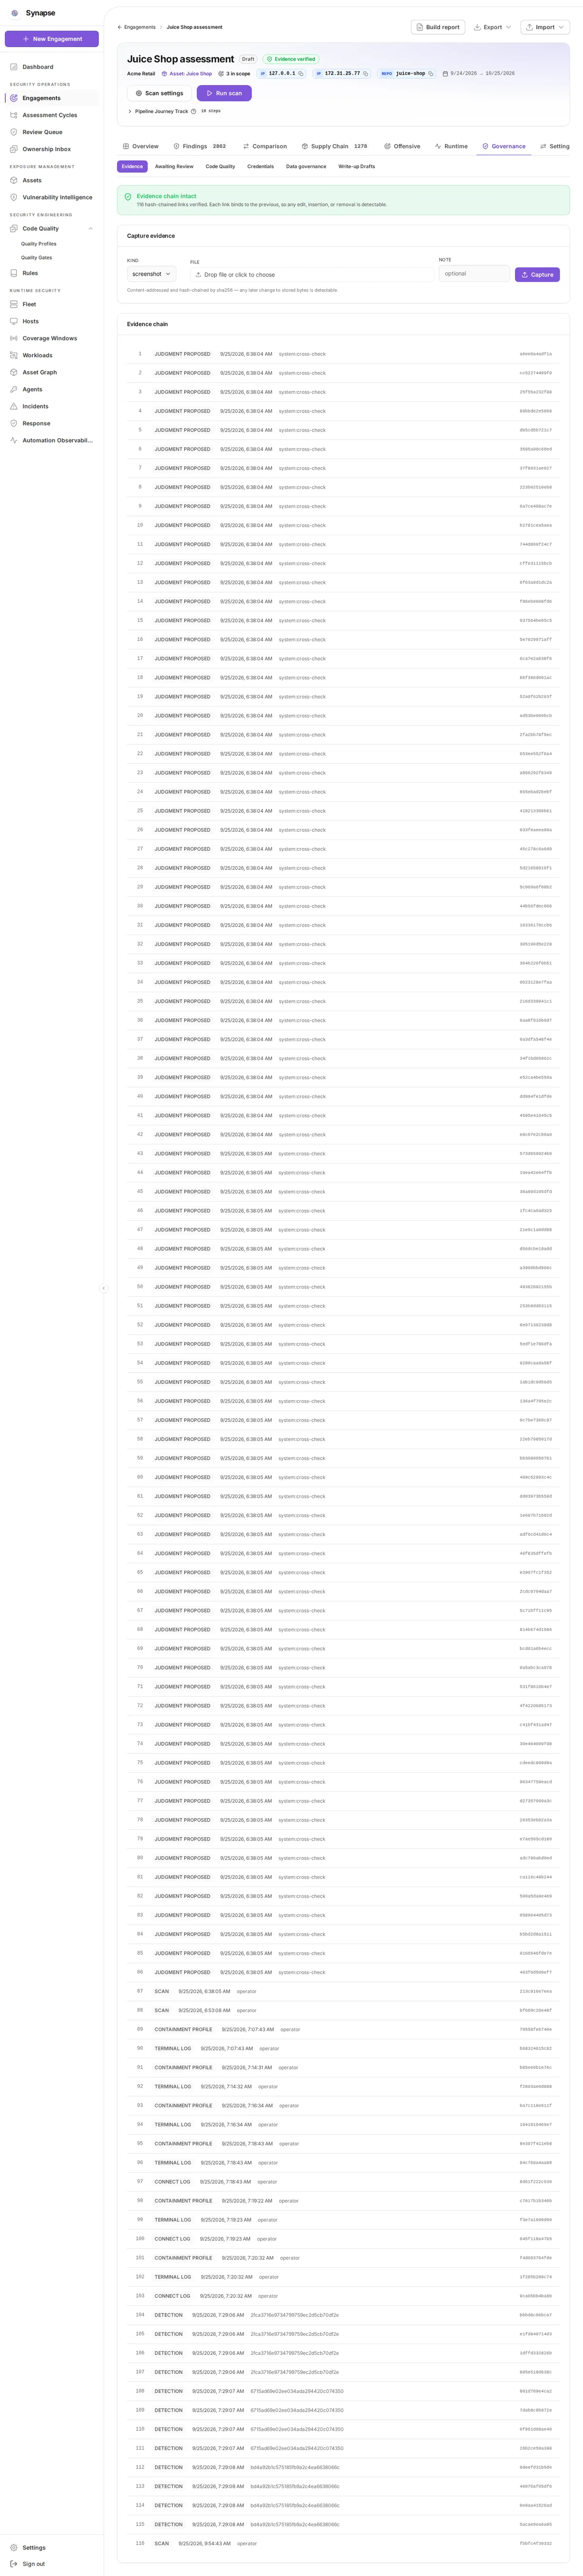
Evidence
/engagements/{id}/evidence
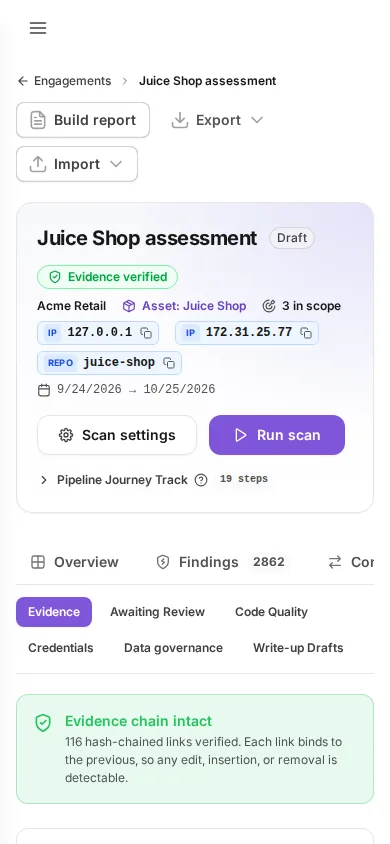
The evidence ledger itself. A broken chain blocks the report.
- The hash-chained, append-only record for this engagement, newest first.
- Press Capture to add a note or a file; both become part of the chain.
- The chain is verified on read; a break is reported and blocks the report rather than being hidden.
- Nothing here can be edited or deleted, which is the point.
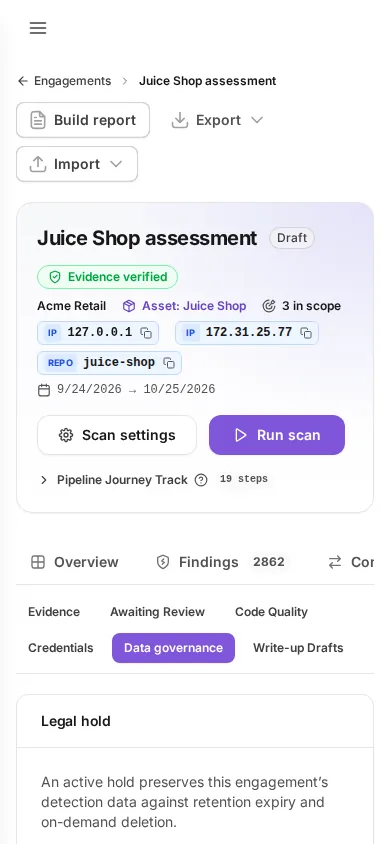
Data governance
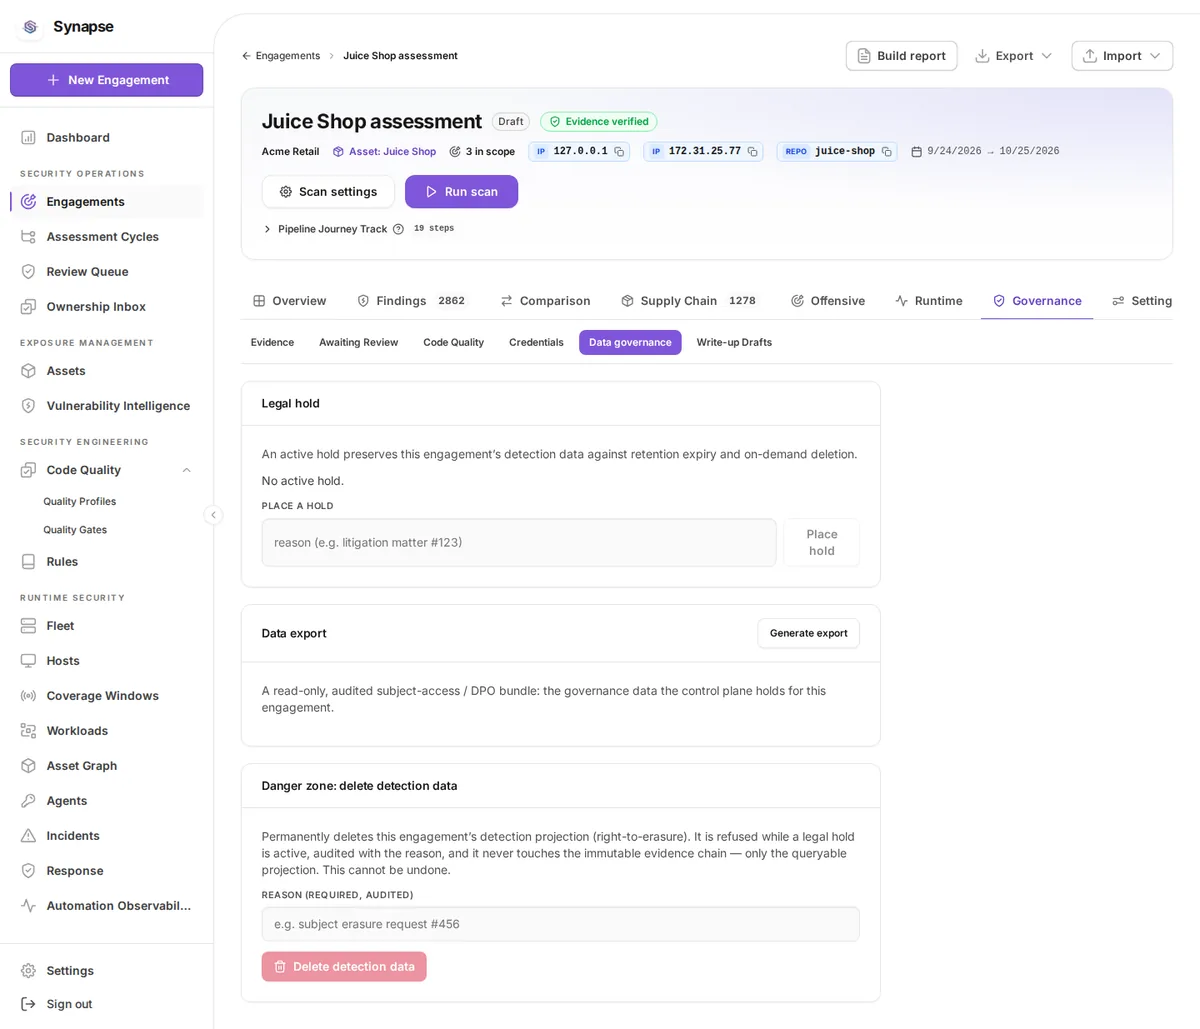
/engagements/{id}/data-governance
Retention and handling for the data this engagement holds.
- Legal hold preserves this engagement's detection data against retention expiry and on-demand deletion. Press Place a hold with a reason; the reason is required and audited.
- A held engagement refuses deletion, so place the hold before you need it.
- Release hold lifts it, and is audited the same way.
- Data export generates the governance bundle for a subject-access request: the detections held for this engagement plus any active holds. Press Download JSON to take it away.
- Danger zone deletes the detection projection on demand. It requires a reason, asks for confirmation, refuses while a hold is in place, and never touches the evidence chain.
- The tab needs
SYNAPSE_FLEET_ENABLEDandSYNAPSE_FLEET_DETECTION_INGEST_ENABLED, because the detection projection is the data it governs.
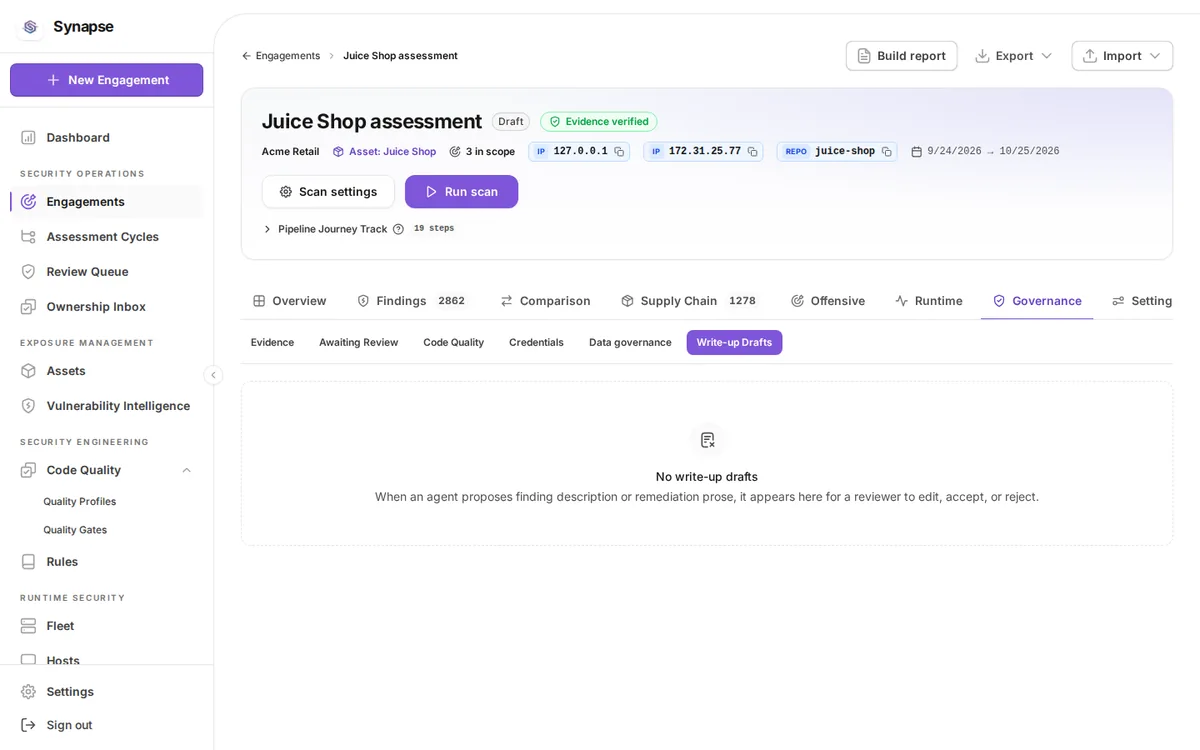
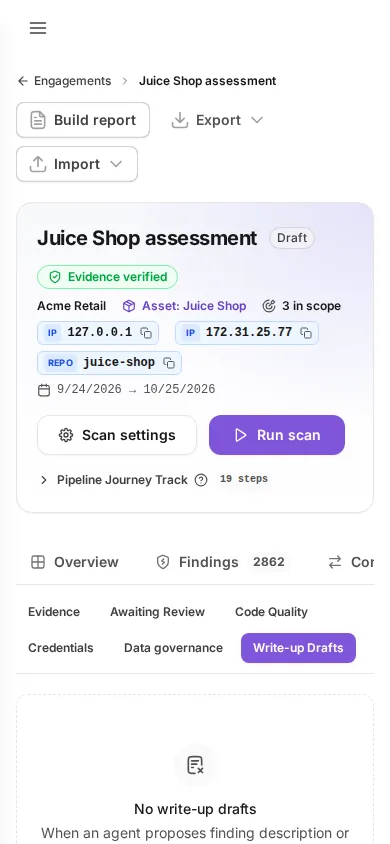
Write-up drafts
/engagements/{id}/writeup-drafts
AI-drafted write-ups, unconfirmed until a human accepts them.
- Drafts a description and a remediation for a finding, as a proposal a human decides on.
- Open the finding the draft is about to judge it in context.
- Edit the draft, then Save, Accept or Reject.
- Nothing reaches the report until it is accepted; no model writes into the report path.
Settings
/engagements/{id}/settings
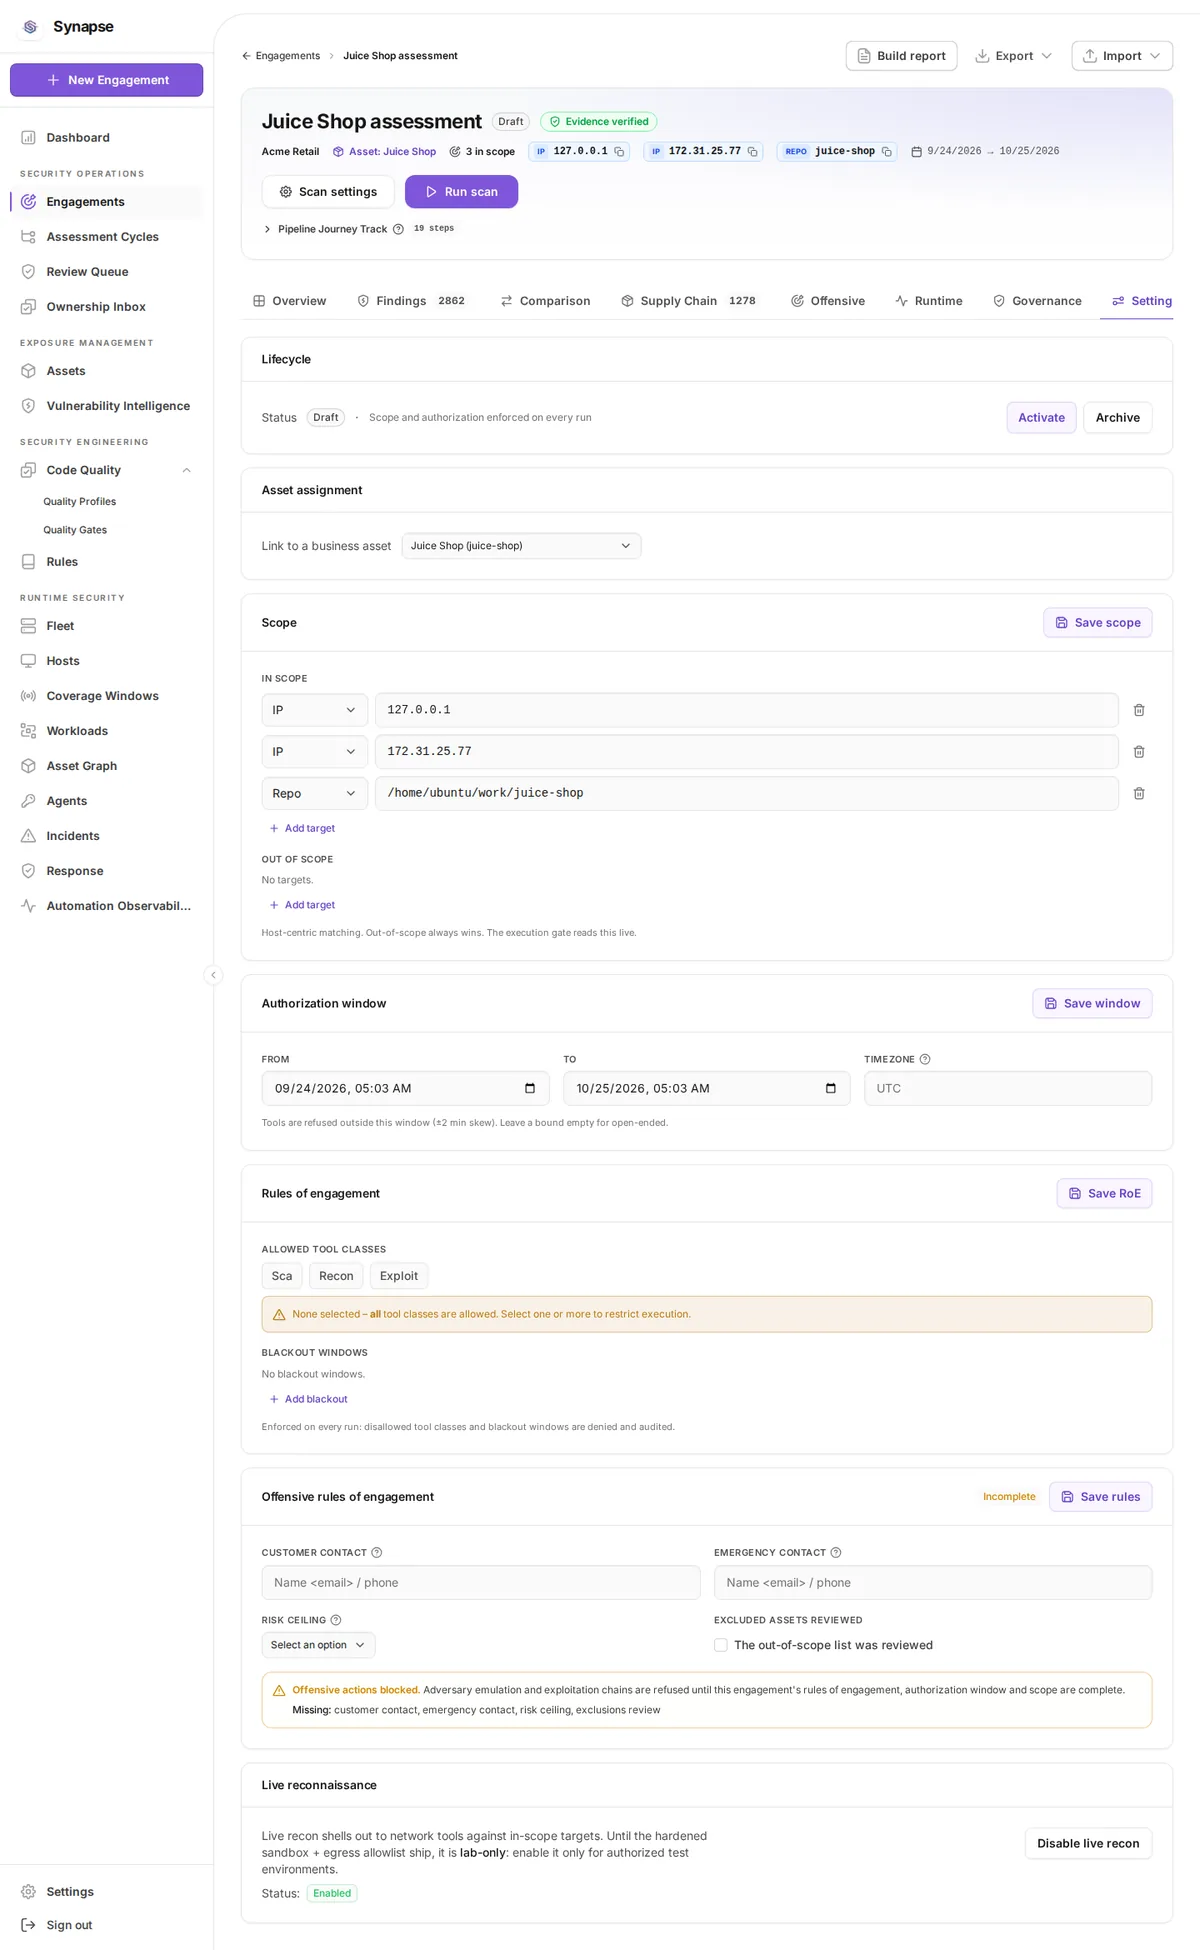
Scope, authorization window, rules of engagement, and the engagement lifecycle.
- Scope lists what is in and out of scope. The execution layer checks it server-side before any tool runs, so this is a control, not a label. Press Save scope.
- Authorization window bounds when execution is permitted. Press Save window.
- Live reconnaissance is the switch that makes execution against a real target possible. Enabling it re-confirms the acceptable-use policy version and records a lab-authorization attestation; both go to the append-only audit log. Disabling needs neither.
- Offensive rules of engagement set the maximum blast radius, from prohibited through low, medium and high. Unset means offensive actions are refused. Press Save RoE.
- Asset assignment binds the engagement to a business asset; Lifecycle activates, completes or archives it.
Asset detail
/assets/{key} and its tabs. The route accepts either the asset id or its tenant-scoped
business key.
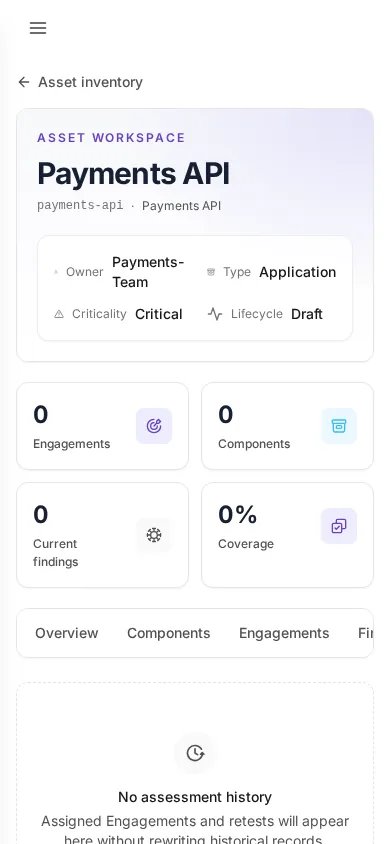
Overview
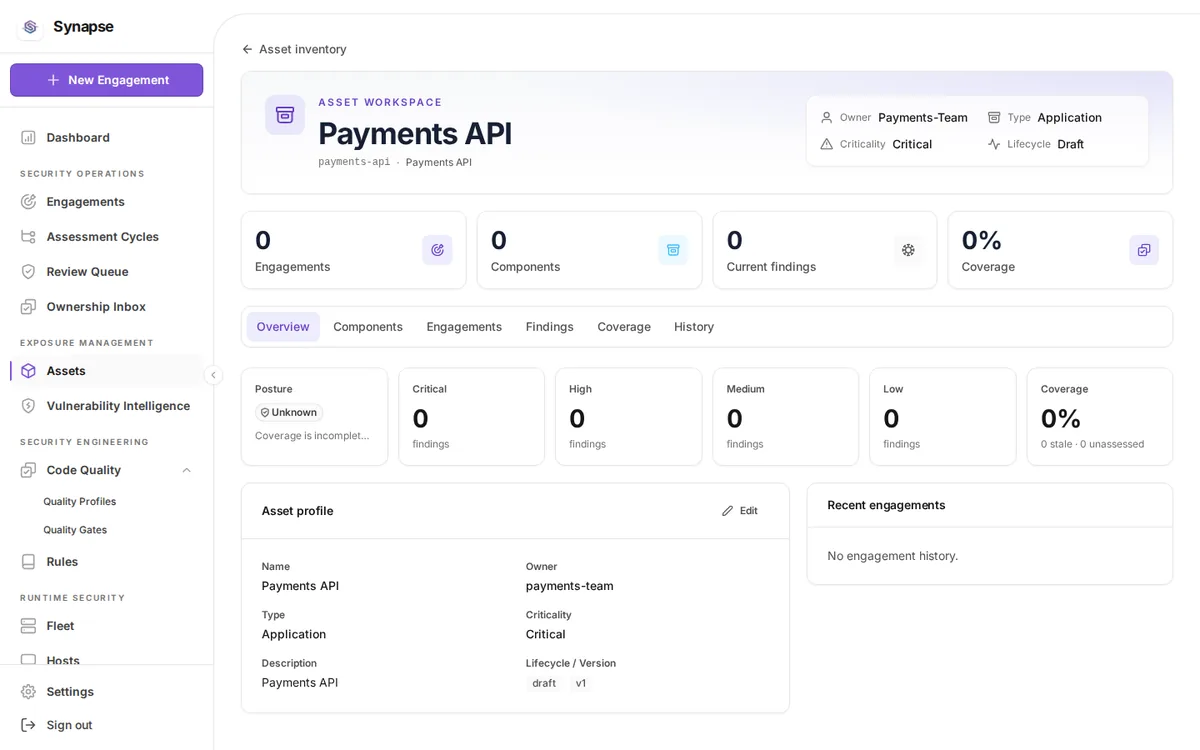
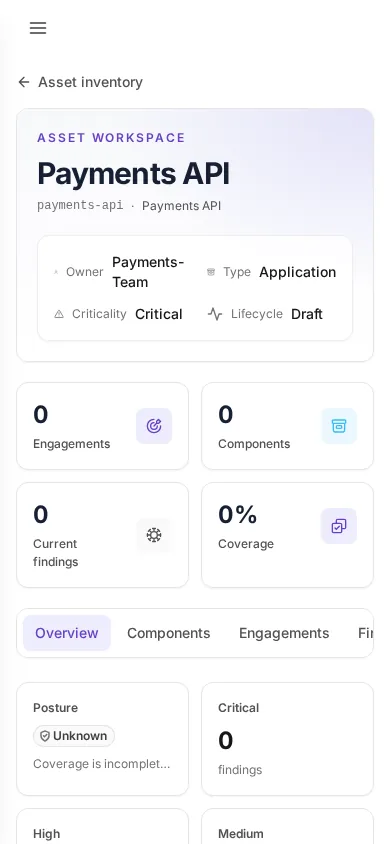
/assets/{key}
Criticality, owner, lifecycle and posture for one business asset.
- Asset profile carries what the asset is: type, criticality, lifecycle and owner. Press the edit control to change them, then Save.
- Criticality drives the remediation deadline an SLA policy derives, so it is a governance field rather than a label.
- Recent engagements links to the assessments that covered this asset.
- Lifecycle moves the asset through its stages; the control offers only the transitions the current state allows.
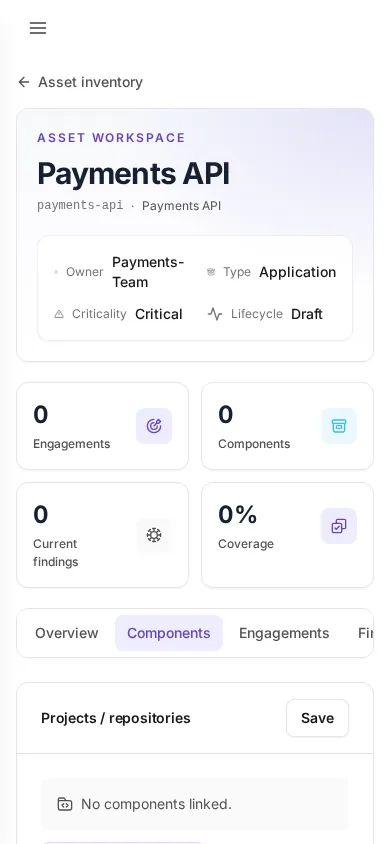
Components
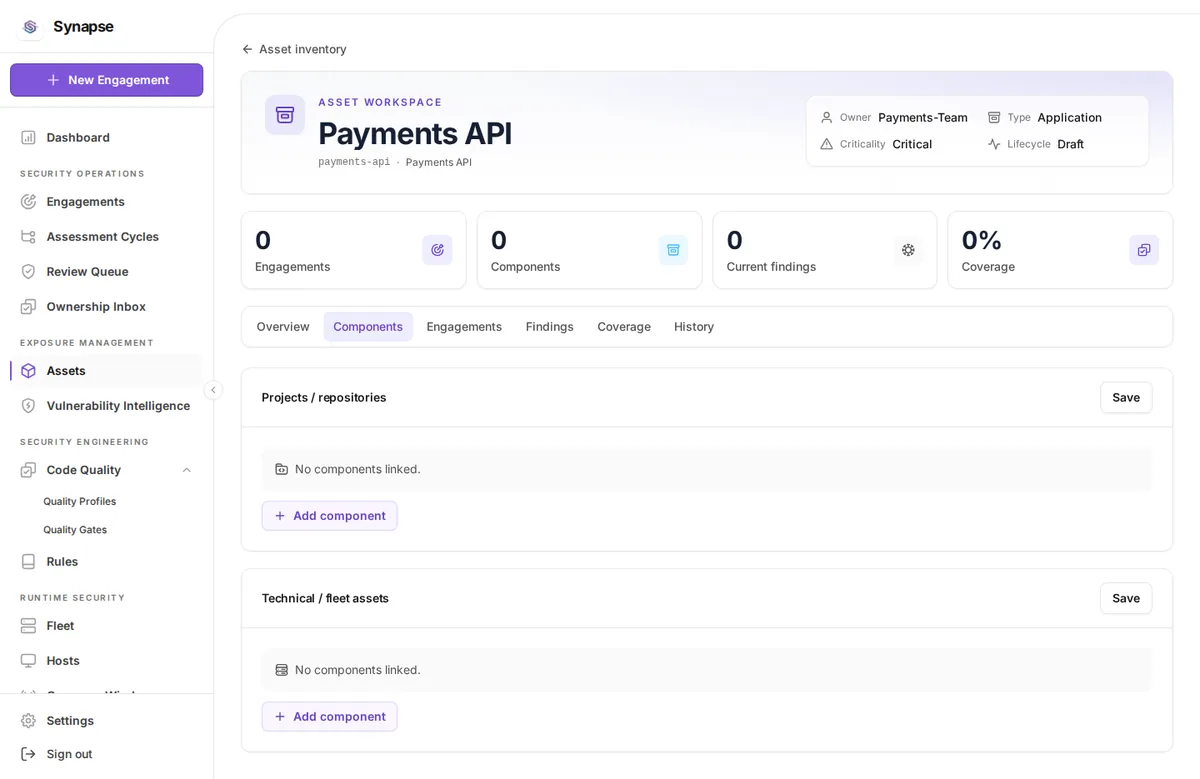
/assets/{key}/components
The projects and technical assets that make up this business asset.
- Projects / repositories lists the code identities bound to this asset.
- Technical / fleet assets lists the hosts, workloads, images and exposures the fleet has attributed to it.
- Together they are the denominator for coverage: what should be assessed, not what happens to have been.
- Add a component with the selector and mark one Primary when the asset has an obvious main repository.
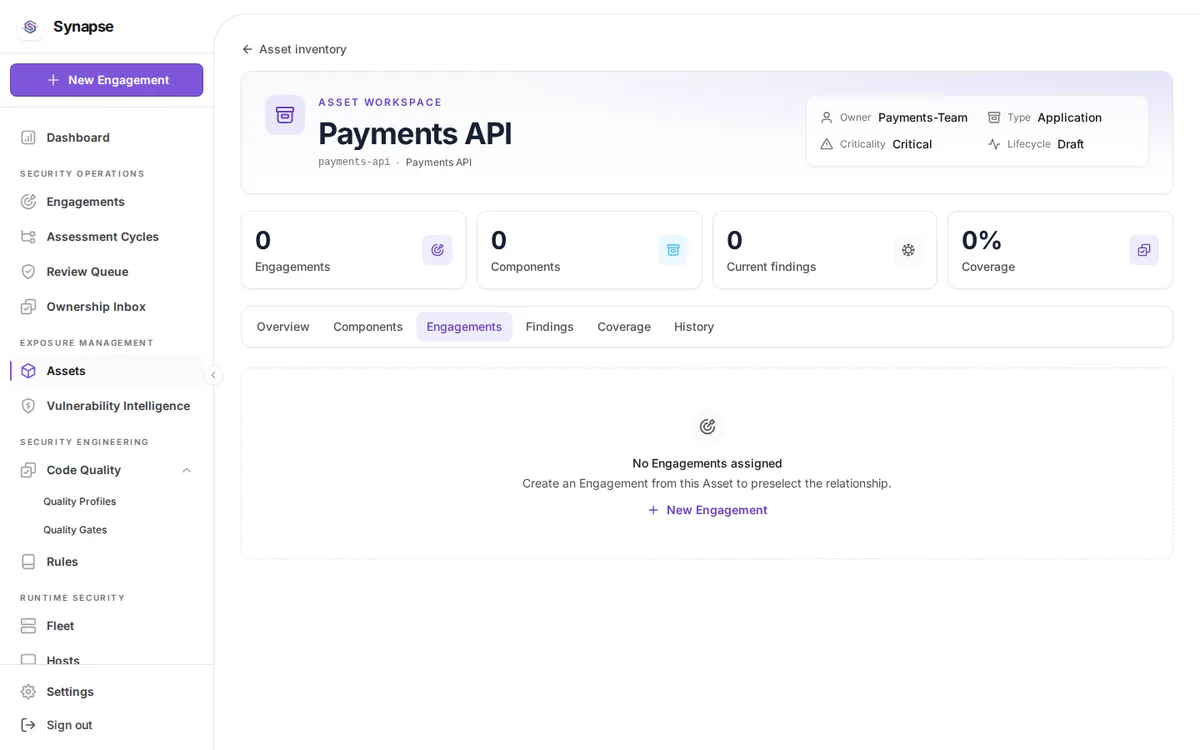
Engagements
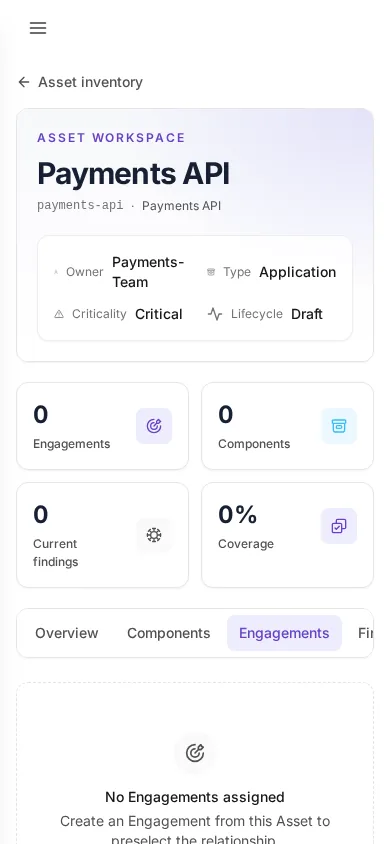
/assets/{key}/engagements
Every assessment that covered this asset.
- Every engagement assigned to this asset, with its status and dates.
- An asset with no engagement says so plainly, which is the state worth noticing on a critical asset.
- Follow one through to its findings.
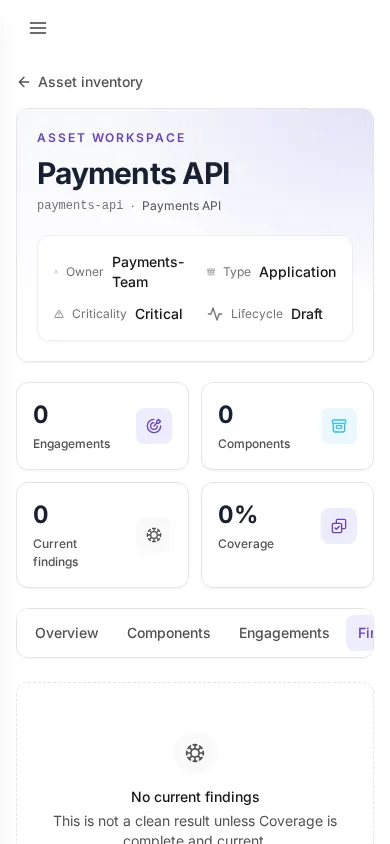
Findings
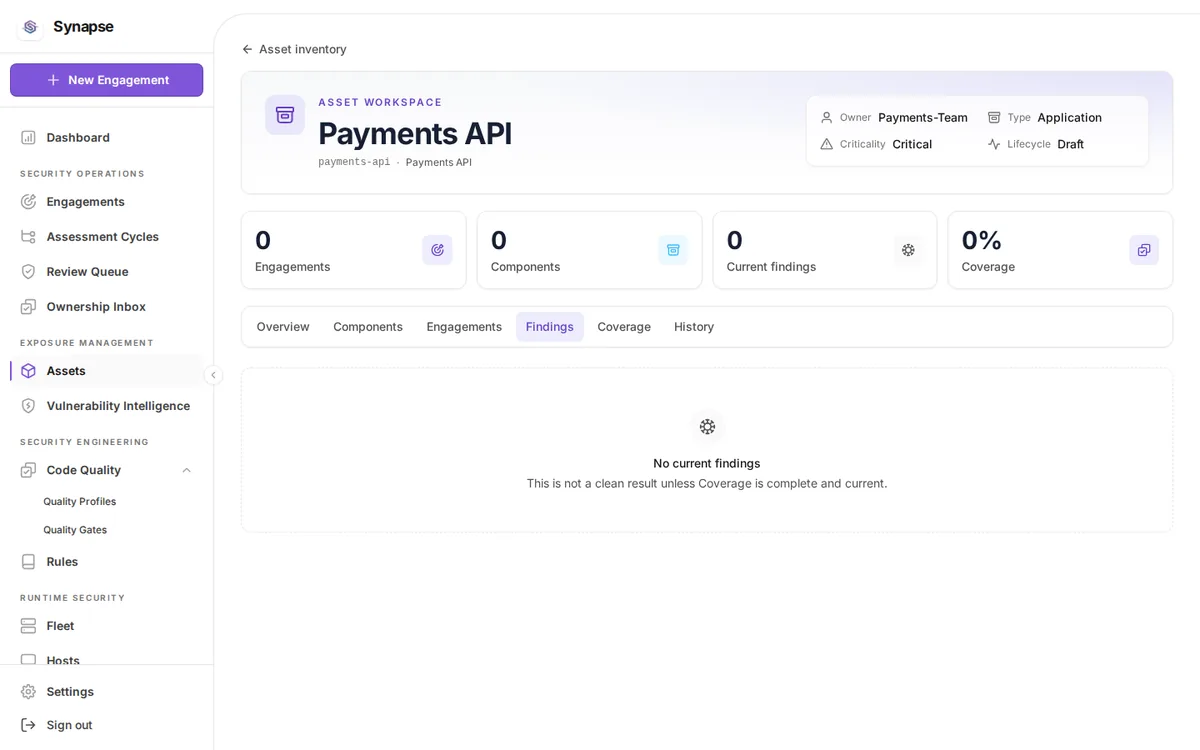
/assets/{key}/findings
Findings aggregated across those assessments.
- The current findings across every engagement that covered this asset, so one screen answers "what is open against this asset".
- Filter and page through them; the list is server-paged, so a large estate stays fast.
- Severity and status are the finding's own, not a copy, so acting here acts on the finding.
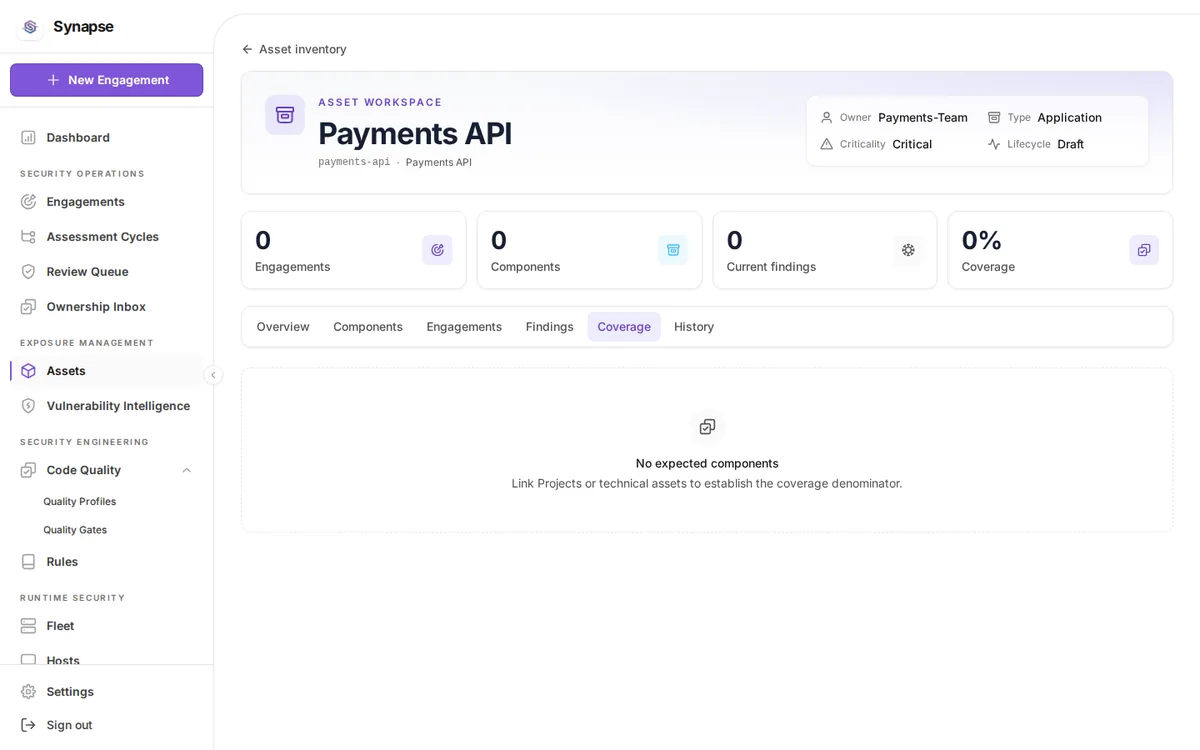
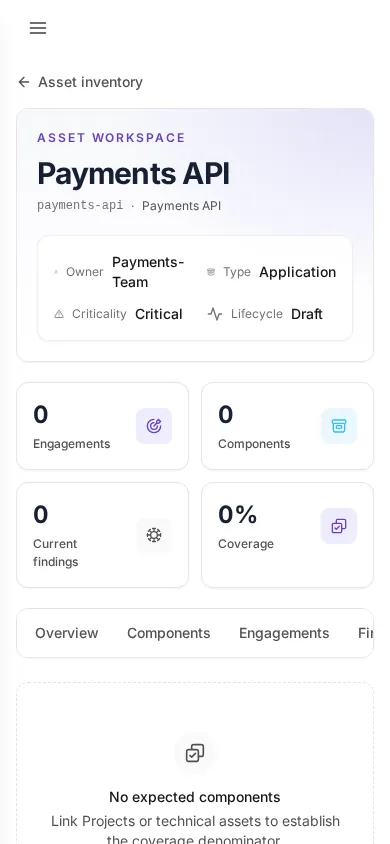
Coverage
/assets/{key}/coverage
Which components were assessed, by what, and how recently.
- Each expected component with its coverage verdict against the freshness target named in the panel title.
- A component never assessed and one assessed too long ago are different verdicts, and both differ from one that is current.
- The counts beside the title break the estate down by verdict.
- Coverage is computed against the components declared on the asset, so an incomplete component list produces a flattering number.
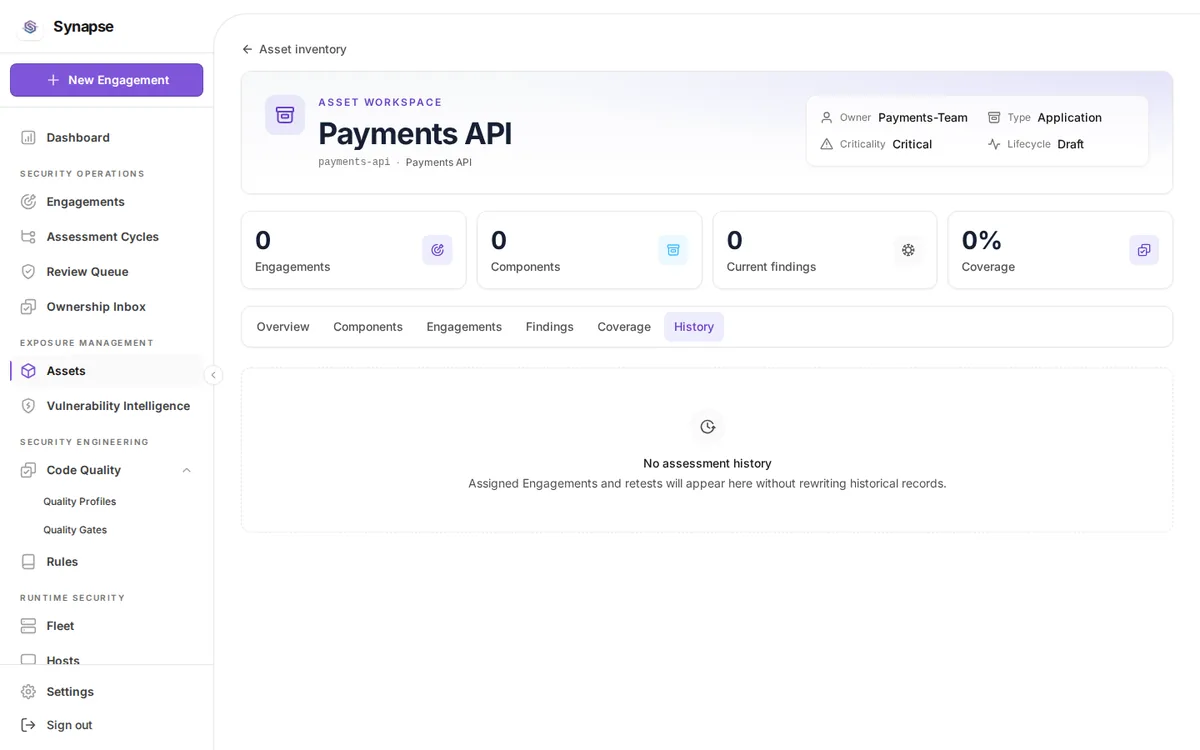
History
/assets/{key}/history
The assessment history for the asset.
- The assessment history for this asset over time: which engagement, when, and what it found.
- Use it to answer how long an asset has gone without assessment, which the coverage verdict summarises but does not date.
Code quality project
/code-quality/projects/{key} and its tabs.
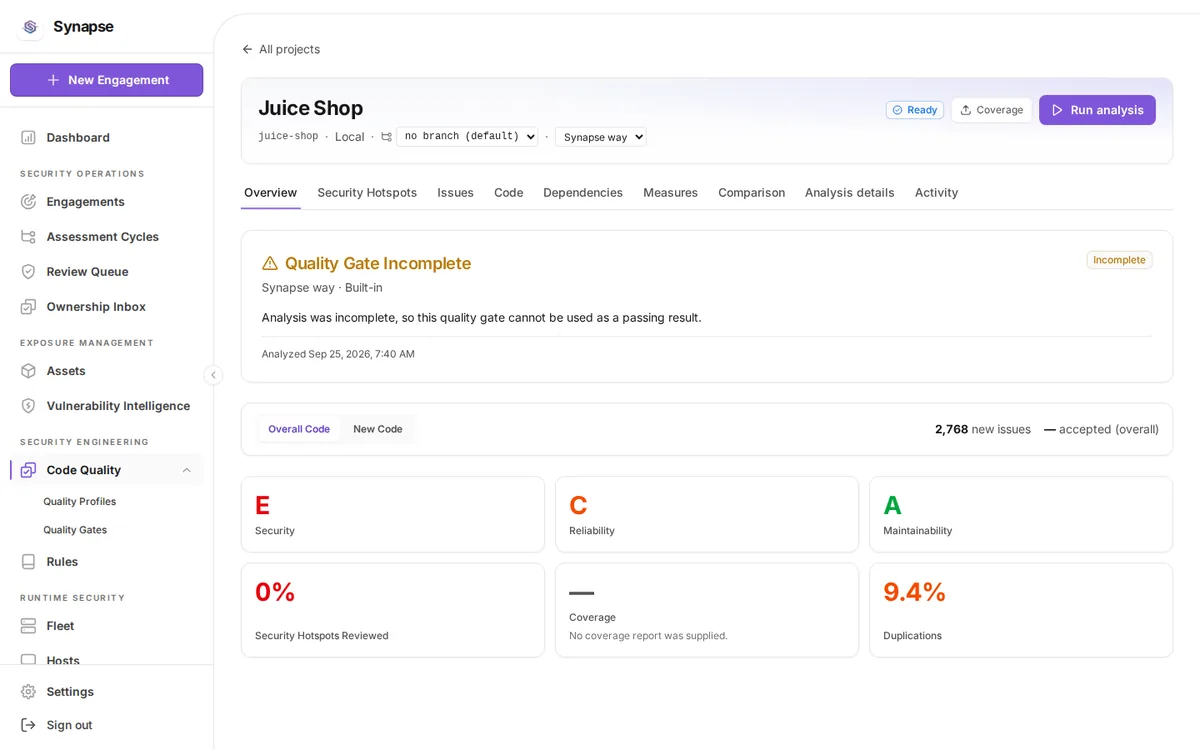
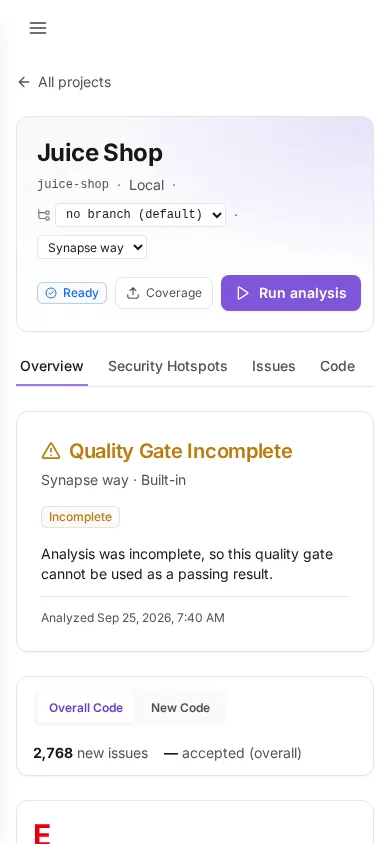
Overview
/code-quality/projects/{key}
Project health, the managed gate verdict, and the trend.
- The quality gate verdict for the selected branch, with each condition, its threshold and the actual value.
- The ratings are Security, Reliability and Maintainability, beside coverage and duplication.
- Switch between Overall Code and New Code; a gate usually fails on new code, which is the code you can still change.
- The branch selector offers the branches that have analyses. A project bound to a local path has no branch name and shows "no branch".
- Press Run analysis to start one, or Coverage to upload a coverage report the analysis cannot produce itself.
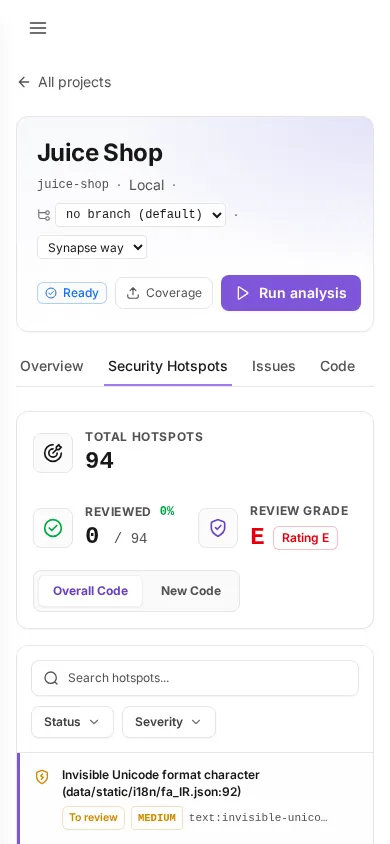
Security hotspots
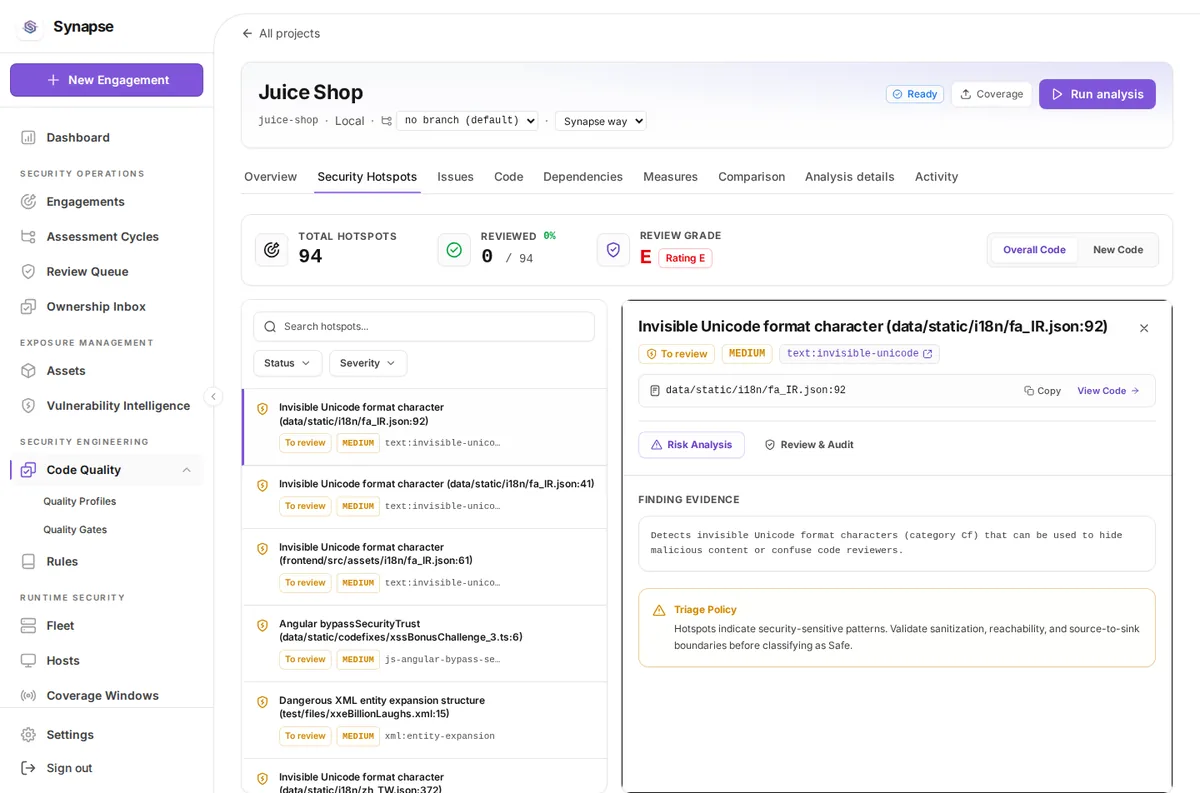
/code-quality/projects/{key}/hotspots
Code needing a security review decision.
- A hotspot is code that needs a human to decide whether it is a vulnerability in this context, not a finding asserting that it is.
- Select one to read the code around it with the rule that raised it.
- Record the decision: it is safe here, or it is a real vulnerability. The decision and its rationale are kept.
- The review percentage on the Overview counts these decisions, so an unreviewed project reads 0% however clean it is.
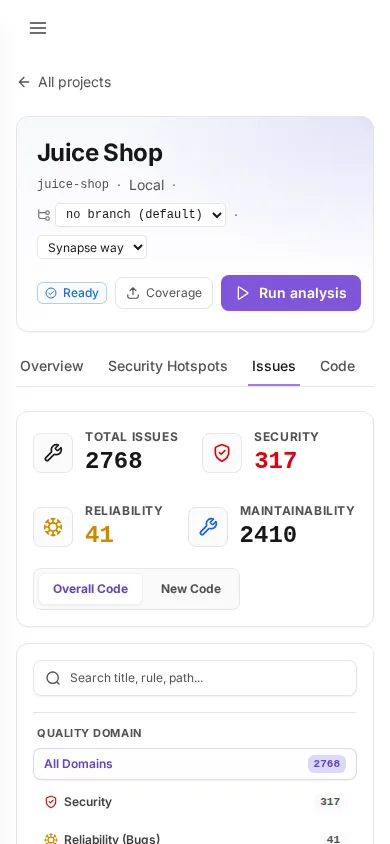
Issues
/code-quality/projects/{key}/issues
Every issue with its rule, severity and status. The inspector shows the review history behind the current status before you reclassify.
- Filter by kind, severity, status, rule and path; the search box matches title, rule and path together.
- Open an issue to read it against its source, with the rule's explanation beside it.
- Change its status and record the rationale; the history is kept and shown in the inspector above the form.
- The code lens shows the issue in place rather than as a line number you have to go and find.

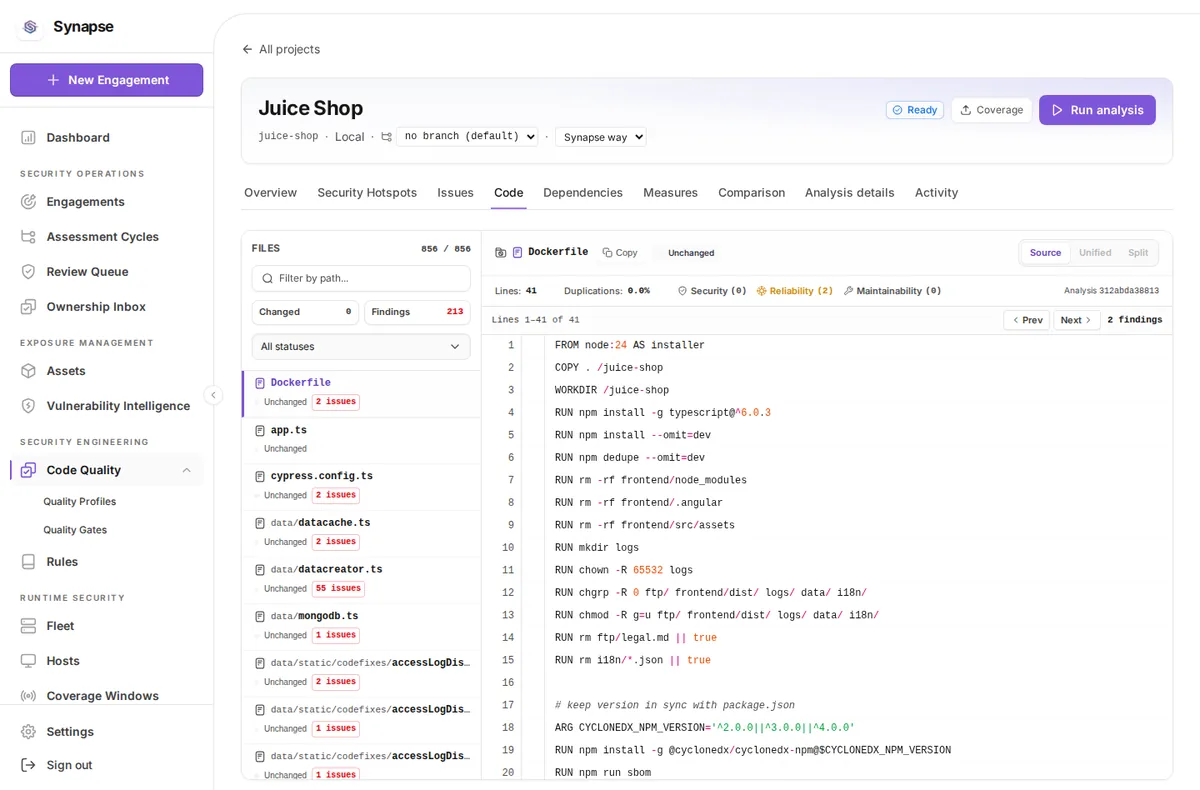
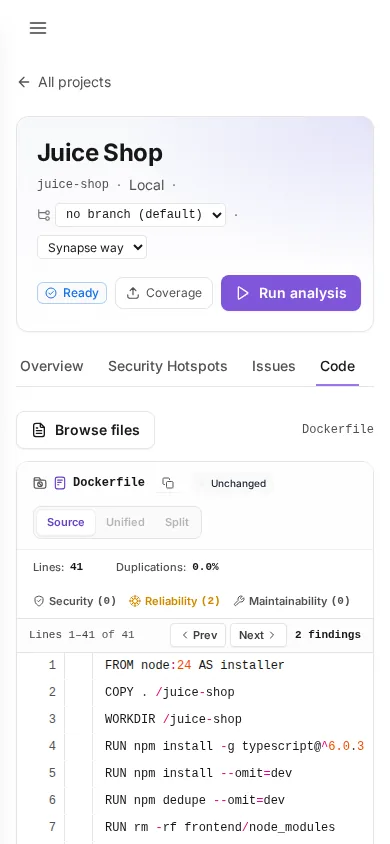
Code
/code-quality/projects/{key}/code
The analysed source, annotated with its findings.
- Browse the source the analysis captured, directory by directory.
- Per-file measures sit beside the tree, so you can see which file carries the issues.
- A file is present only when the analysis published its source; a project that has not published shows none.
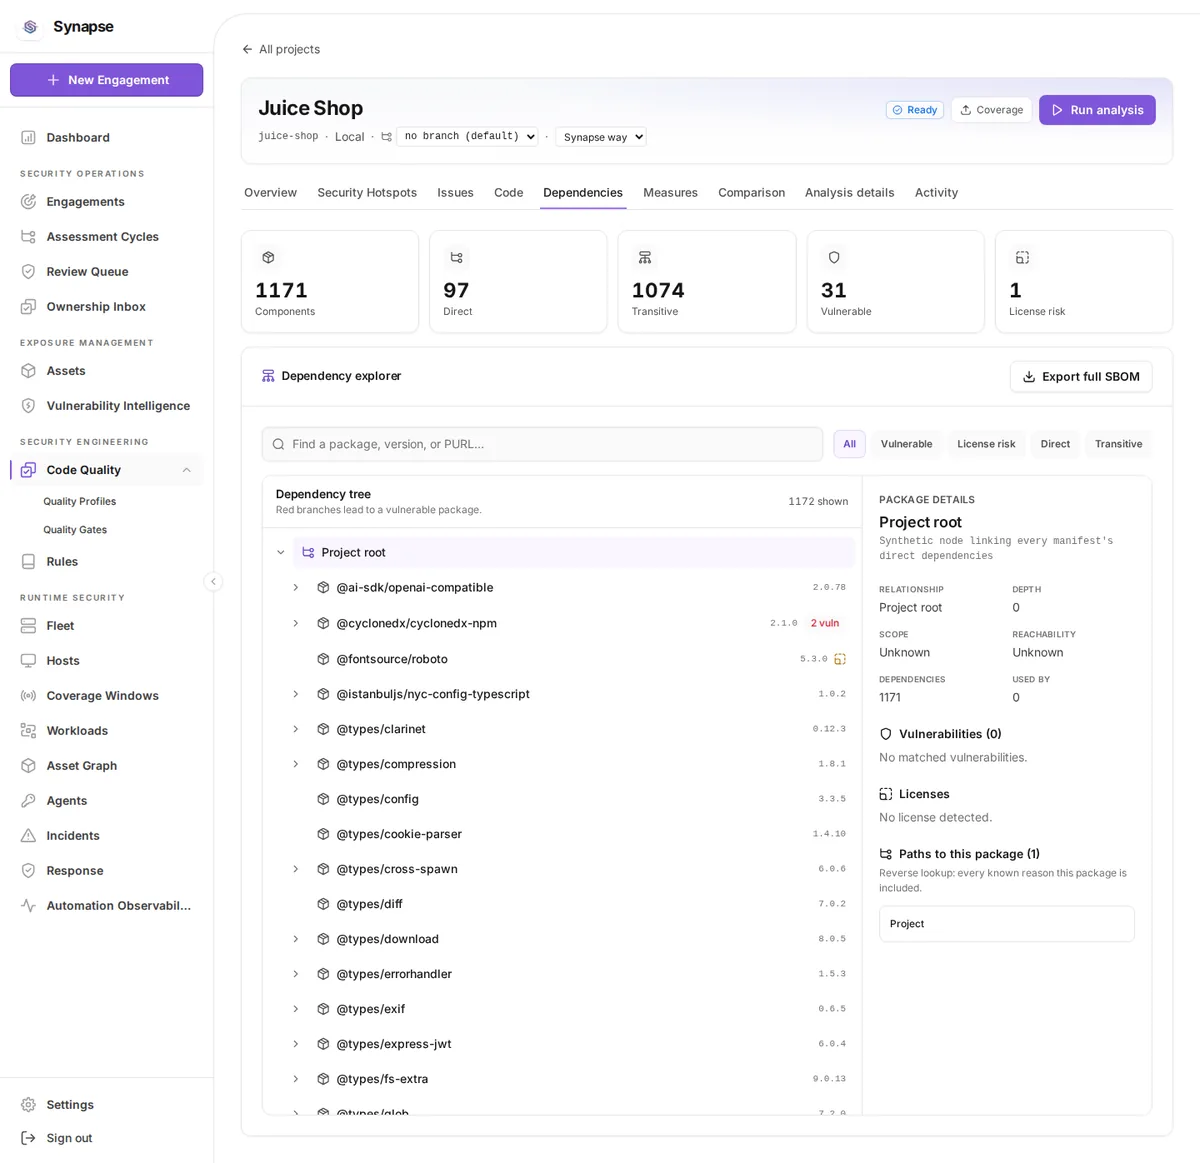
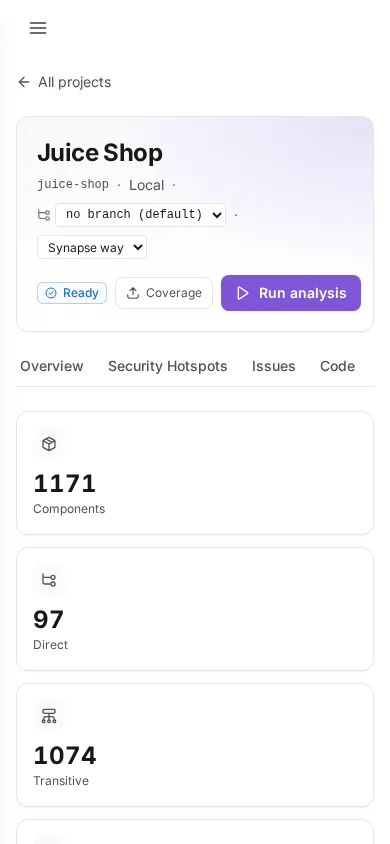
Dependencies
/code-quality/projects/{key}/dependencies
The dependency tree with risky paths marked.
- The project's dependency tree, resolved from its manifests and lockfiles.
- Search by package, version or PURL.
- Filter to what you are looking for, then expand a node to walk the tree.
- Export the SBOM to take the inventory away in a standard format.
Measures
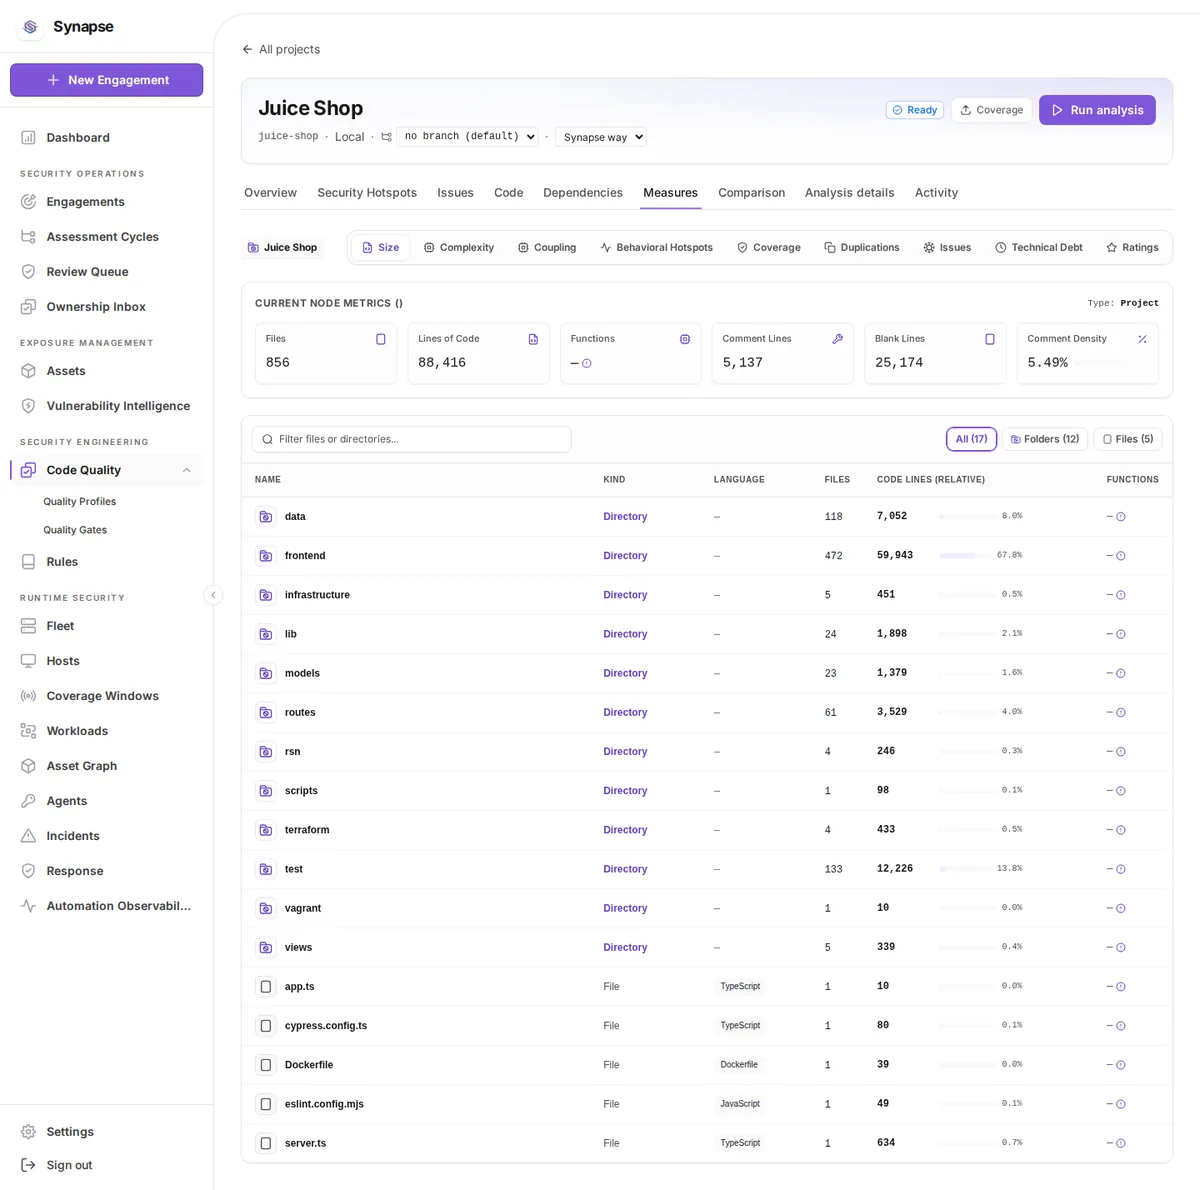
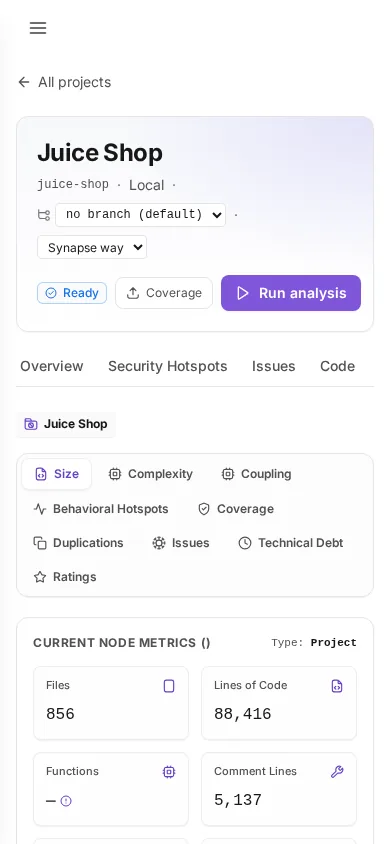
/code-quality/projects/{key}/measures
The measured metrics for the analysis.
- Choose a Measures domain to switch between reliability, security, maintainability, coverage, duplication and size.
- The list is a file tree: press a directory to descend, and the breadcrumb takes you back.
- Filter files or directories by name.
- Sort by a metric to find the worst files in that domain, which is usually the fastest route to the work worth doing.
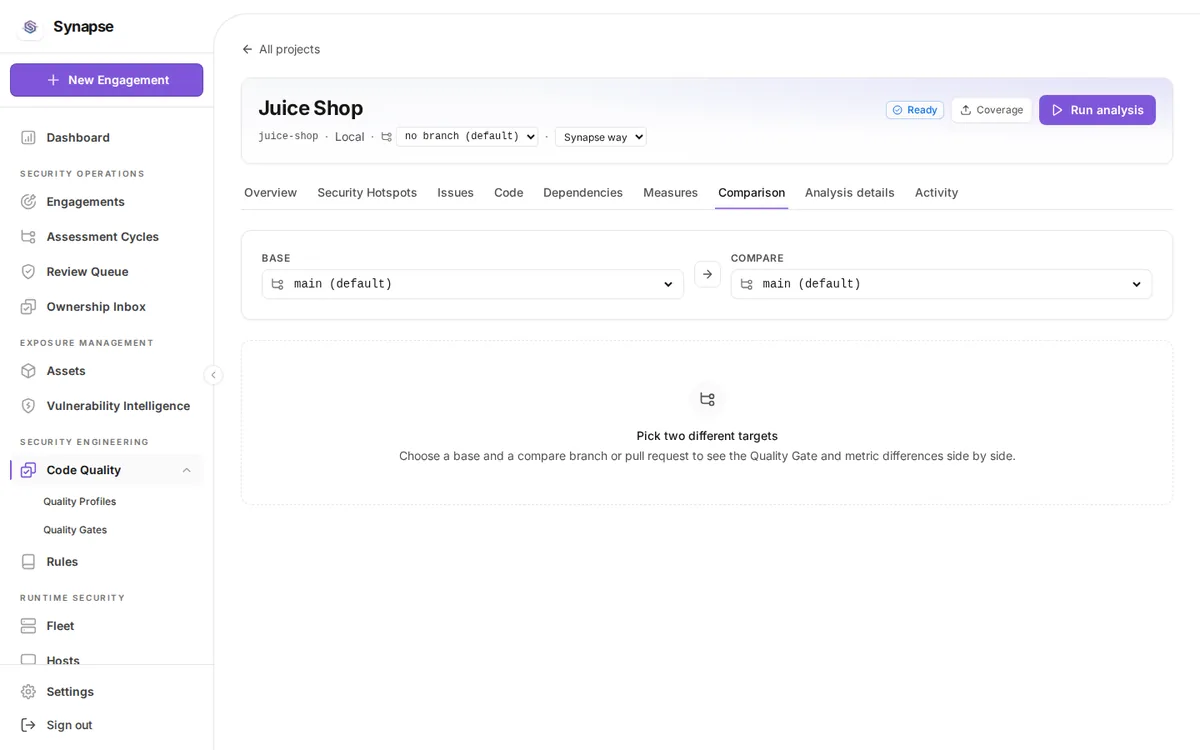
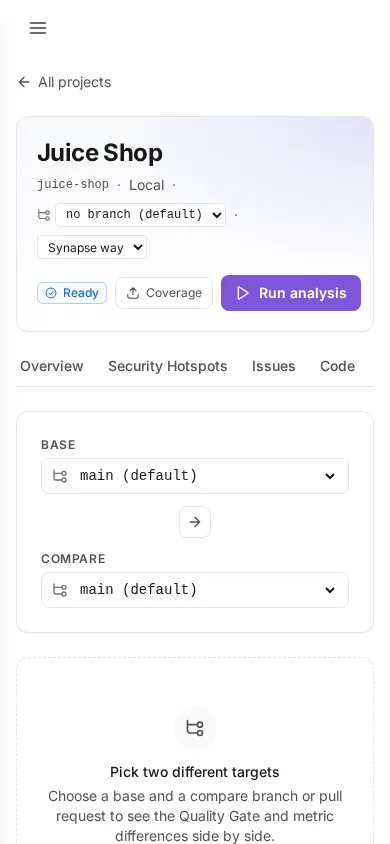
Compare
/code-quality/projects/{key}/compare
Two analyses compared.
- Pick two targets, a base and a compare; they must be different.
- Swap base and compare reverses the direction without re-picking.
- The result reports what moved between them, metric by metric, rather than two independent snapshots you have to diff by eye.
Analysis
/code-quality/projects/{key}/analysis
One analysis in detail.
- The details of one analysis: when it ran, what produced it, and the gate it was evaluated against.
- Use it to answer why a gate verdict came out as it did, including which conditions were evaluated.
Activity
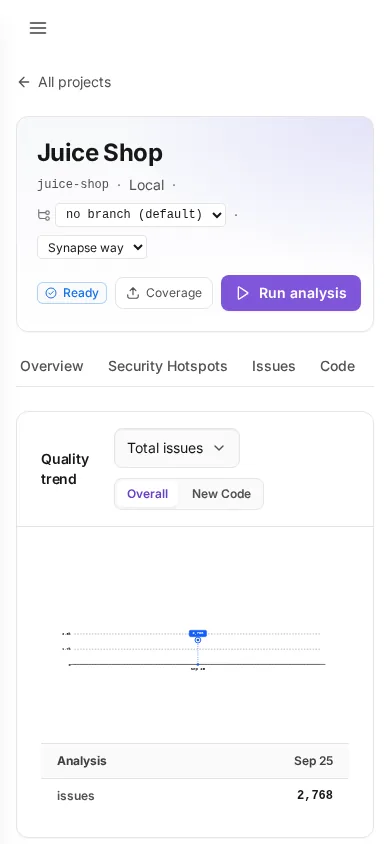
/code-quality/projects/{key}/activity
The analysis history, which is where a CI push lands.
- The analysis history for the project, newest first.
- Each entry carries its gate verdict, so a regression is visible as a change rather than an isolated result.
- Follow an entry to its analysis details.